Article Text

Abstract
Objectives Explore (1) associations between maternal body mass index (BMI), demographic and clinical characteristics, (2) longitudinal trends in BMI, (3) geographical distributions in prevalence of maternal overweight and obesity.
Design Retrospective population-based study.
Setting Linked, anonymised, routinely collected healthcare data and official statistics from Northern Ireland.
Participants All pregnancies in Northern Ireland (2011–2017) with BMI measured at ≤16 weeks gestation.
Methods Analysis of variance and χ2 tests were used to explore associations. Multiple linear regression was used to explore longitudinal trends and spatial visualisation illustrated geographical distribution. Main outcomes are prevalence of overweight (BMI ≥25 kg/m2) and obesity (BMI ≥30 kg/m2).
Results 152 961 singleton and 2362 multiple pregnancies were included. A high prevalence of maternal overweight and obesity in Northern Ireland is apparent (singleton: 52.4%; multiple: 48.3%) and is increasing. Obesity was positively associated with older age, larger numbers of previous pregnancies and unplanned pregnancy (p<0.001). BMI category was also positively associated with unemployment (35% in obese class III vs 22% in normal BMI category) (p<0.001). Higher BMI categories were associated with increased rate of comorbidities, including hypertension (normal BMI: 1.8% vs obese III: 12.4%), diabetes mellitus (normal BMI: 0.04% vs obese III: 1.29%) and mental ill-health (normal BMI: 5.0% vs obese III: 11.8%) (p<0.001). Prevalence of maternal obesity varied with deprivation (most deprived: 22.8% vs least deprived: 15.7%) (p<0.001). Low BMI was associated with age <20 years, nulliparity, unemployment and mental ill-health (p<0.001).
Conclusions The prevalence of maternal BMI >25 kg/m2 is increasing over time in Northern Ireland. Women are entering pregnancy with additional comorbidities likely to impact their life course beyond pregnancy. This highlights the need for prioritisation of preconception and inter-pregnancy support for management of weight and chronic conditions.
- obesity
- maternal health
- maternal welfare
- epidemiology
- social determinants of health
Data availability statement
No data are available.
This is an open access article distributed in accordance with the Creative Commons Attribution Non Commercial (CC BY-NC 4.0) license, which permits others to distribute, remix, adapt, build upon this work non-commercially, and license their derivative works on different terms, provided the original work is properly cited, appropriate credit is given, any changes made indicated, and the use is non-commercial. See: http://creativecommons.org/licenses/by-nc/4.0/.
Statistics from Altmetric.com
Key points
Question
This study explored changing distribution of overweight and obesity across Northern Ireland, both geographically and over time. It also investigated the association between body mass index (BMI) class and demographic and socioeconomic background, and presence of comorbidities in early pregnancy.
Finding
The prevalence of maternal overweight and obesity is increasing in Northern Ireland and varies with geography and demographic background. This study also shows that overweight and obesity is now an issue affecting large proportions of pregnancies across all socioeconomic areas, with the most affluent areas relatively spared but not unaffected. Prevalence of maternal comorbidities, including hypertension and mental ill-health, increased with BMI category in early pregnancy.
Meaning
Large proportions of women are entering pregnancy with increased BMI and other comorbidities. This finding highlights the need for prioritisation of preconception and inter-pregnancy care in order to optimise health prior to pregnancy. Women should be supported in making positive changes to nutrition and lifestyle behaviours affecting weight and management of chronic conditions.
Introduction
Globally, prevalence of overweight and obesity in the general population has increased dramatically in the last four decades and currently over 50% of all women are overweight or obese.1 A small number of studies suggest that this trend is reflected in the obstetric population.2 3
It is well established that maternal obesity is associated with increased maternal, fetal and neonatal risks.4 5 At the extreme, overweight and obesity are related to excess maternal and infant death and severe morbidity.6 7 Women who are obese are more likely to develop gestational diabetes,5 8 9 venous thromboembolism,10 gestational hypertension5 8 and pre-eclampsia.5 11 Maternal obesity also increases the likelihood of induction of labour, caesarean section and prolonged labour.8 12 Postnatal complications associated with obesity include increased risk of genital and urinary tract infections,13 wound infection8 13 and postpartum haemorrhage.8 In the longer term, effects of maternal obesity and gestational diabetes include a marked increased risk of developing type 2 diabetes.14
Infants of obese mothers are also exposed to increased risks including prematurity,5 8 15 fetal growth restriction and macrosomia,5 8 15 low Apgar scores,16 stillbirth,8 17 cerebral palsy,18 congenital defects19 and neonatal and infant death.20 21 Maternal obesity also impacts the accuracy and completion rates of fetal monitoring, screening and diagnostic tests due to increased maternal abdominal adipose tissue.4 22
Obesity in pregnancy not only has implications in the perinatal period, but also presents continuing lifelong implications for offspring.23 Such associations are observed in increased rates of childhood obesity24 and cardio-metabolic (eg, type 1 diabetes)25 and respiratory (eg, asthma)26 ill-health. Emerging evidence also points to the influence of in utero exposure to maternal obesity on fetal neurological development, particularly cognitive, emotional and behavioural development, and motor, spatial and verbal skills.27 Furthermore, meta-analyses have shown a relationship between maternal obesity and autism spectrum disorder and attention deficit hyperactivity disorder.27
Maternal obesity is also associated with a more complex antenatal pathway and increased financial burden. Women with obesity often require consultant led or shared care, and input from multiple specialities. Trained personnel must be available in the peripartum period to provide safe and effective care, for example a dedicated obstetric anaesthetist.4 Resources are further impacted by additional scanning time, repeated fetal anomaly scans, screening for gestational diabetes mellitus, the need to commence anticoagulation therapy and prolonged length of hospital admission after delivery.4 Costs to providers increase further as they must also ensure appropriate facilities and specialist equipment with appropriate dimensions and load-bearing capacity for women pregnant with obesity.4 28
Guidance from The Royal College of Obstetricians and Gynaecologists and The National Institute for Health and Care Excellence suggests that primary healthcare providers ensure all women with a body mass index (BMI) of 30 kg/m2 or greater have an opportunity to optimise their weight before pregnancy.4 29 30 Suggested models of care include delivery of advice on weight and lifestyle during preconception counselling or contraceptive consultations.4 Yet, by making every contact count, preconception care could be embedded more widely and systematically within other pre-existing healthcare services, for example, sexual and reproductive healthcare clinics or in community pharmacies.31 32
In 2017, the National Maternity and Perinatal Audit provided data on maternal characteristics throughout England, Scotland and Wales, however, Northern Ireland did not contribute to data collection.33 Of note, Northern Ireland is the most deprived nation in the UK,34 and has some of the poorest perinatal outcomes in the UK.35 It is therefore particularly important to understand trends in maternal overweight and obesity, how these impact maternal and child health, and consider future implications for healthcare service design and delivery. As such, the aims of this study were to (1) assess demographic and clinical characteristics of the maternal population in Northern Ireland women in relation to BMI category, (2) to explore trends in BMI in early pregnancy over time in both singleton and multiple pregnancies and (3) to explore the relationship between deprivation and geography, and prevalence of maternal overweight and obesity.
Methods
A retrospective population-based study was conducted using routinely collected data from the Northern Ireland Maternity System (NIMATS). NIMATS holds maternal demographic and healthcare data including medical and obstetric history, for all pregnancies (including stillbirths) in Northern Ireland from booking (defined in this study as a gestational age ≤16 weeks) until discharge. Data were retrieved from 2011 to the point of full regional coverage.
Inclusion criteria were: (1) all pregnancies occurring in Northern Ireland between 1 January 2011 and 31 December 2017 and (2) booking visit (defined as first scheduled antenatal visit) conducted at 16 weeks gestation or less. Three thousand four hundred and eighty-one (2.1%) singleton pregnancies with missing BMI data were excluded.
Maternal BMI is calculated from measured height and weight at the mother’s booking appointment and categorised according to the WHO’s (2000) definition: underweight (<18.5 kg/m2); normal weight (18.5–24.99 kg/m2); overweight (25.00–29.99 kg/m2); obese I (30.00–34.99 kg/m2); obese II (35.00–39.99 kg/m2) and obese III (≥40 kg/m2).36
The Northern Ireland Multiple Deprivation Measure (NIMDM 2017) was used to estimate maternal deprivation.37 The NIMDM provides a mechanism for ranking super output areas from most deprived (rank 1) to least deprived (rank 890). It represents a combination of seven weighted domains (25% ‘income’, 25% ‘employment’, 15% ‘health and disability’, 15% ‘education, skills & training’, 10% ‘access to services’, 5% ‘living environment’ and 5% ‘crime & disorder’). The NIMDM provides a method of comparing relative deprivation at a point in time, but not extent of deprivation in each area. Due to small numbers of women expecting multiples, analysis of deprivation was restricted to the singleton dataset.
Statistical disclosure control
Due to statistical disclosure controls for administrative health data, small counts of fewer than 10 were removed. Data on ethnicity for non-white mothers were unavailable due to small numbers. All ethnicities other than white were reported as ‘other’ due to small counts. Twins and higher order pregnancies were analysed as one cohort. For comparison of characteristics across BMI categories, age was combined into two groups (<30 years; 30+ years). For longitudinal analysis, BMI categories were combined into three groups (underweight and normal; overweight; obese I, II and III). Where combining categories was not possible, small cell counts were suppressed.
Statistical analysis
Descriptive statistics were used to describe demographic and clinical characteristics of women, and missing data across each BMI category. Analysis of variance (continuous variables) and χ2 tests (categorical variables) were used to analyse the differences across BMI categories. Statistical tests were considered significant at p<0.01.
An unadjusted linear regression was applied with BMI as the outcome and year of booking as the explanatory variable to investigate changes in BMI over time. Further, multiple linear regression was applied with BMI as the outcome and year of booking, age at booking and number of previous births as explanatory variables. Age and number of previous births were included in this adjusted model as they have previously been shown to contribute to increased BMI. A full model was then built on other demographic characteristics found to be related to BMI, including planned pregnancy, employment and ethnicity. Linear regression was then repeated with the additional demographic characteristics sequentially removed item-wise to explore the effect of each variable.
The NIMATS (maternal data) and NIMDM (deprivation data) were linked by super output area code.38
The prevalence of maternal overweight and obesity was then calculated as a percentage of the total pregnancies in each super output area. Deprivation was categorised into fifths in the first instance. However, the availability of the large country-wide dataset allowed for a more detailed evaluation of this relationship. Thus, super output areas were grouped into urban, rural or mixed, and prevalence of overweight and obesity plotted against NIMDM rank. A smoothed curve was then fitted using the locally weighted smoothing method, with a shaded 95% CI. Two super output areas with small counts were removed from the scatter graph to prevent disclosure, however, the smoothed curve is based on the full dataset.
The singleton cohort was grouped by super output area, and the prevalence of overweight and obesity calculated for each area. Super output area boundaries were obtained in geographical information system format.38 These were used to generate a map of prevalence of overweight and obesity across Northern Ireland. Two super output areas had small counts and were therefore suppressed to prevent disclosure by treating them as missing values.
All statistical analyses were performed using R,39 with geographical representation of the prevalence of maternal overweight and obesity performed using the sf package.40
Results
The dataset contained 199 705 pregnancies. After removal of duplications, pregnancies with missing BMI data and booking visits after 16 weeks gestation, 152 961 singleton and 2362 multiple (2323 twin; 39 higher order) pregnancies remained (figure 1). Mean (SD) gestation at booking within the study population was 10.56 (1.8) weeks. Within the singleton cohort, 77 313 mothers contributed single pregnancy, while two pregnancies were contributed by 30 271 mothers and three or more pregnancies were contributed by 4891 mothers.
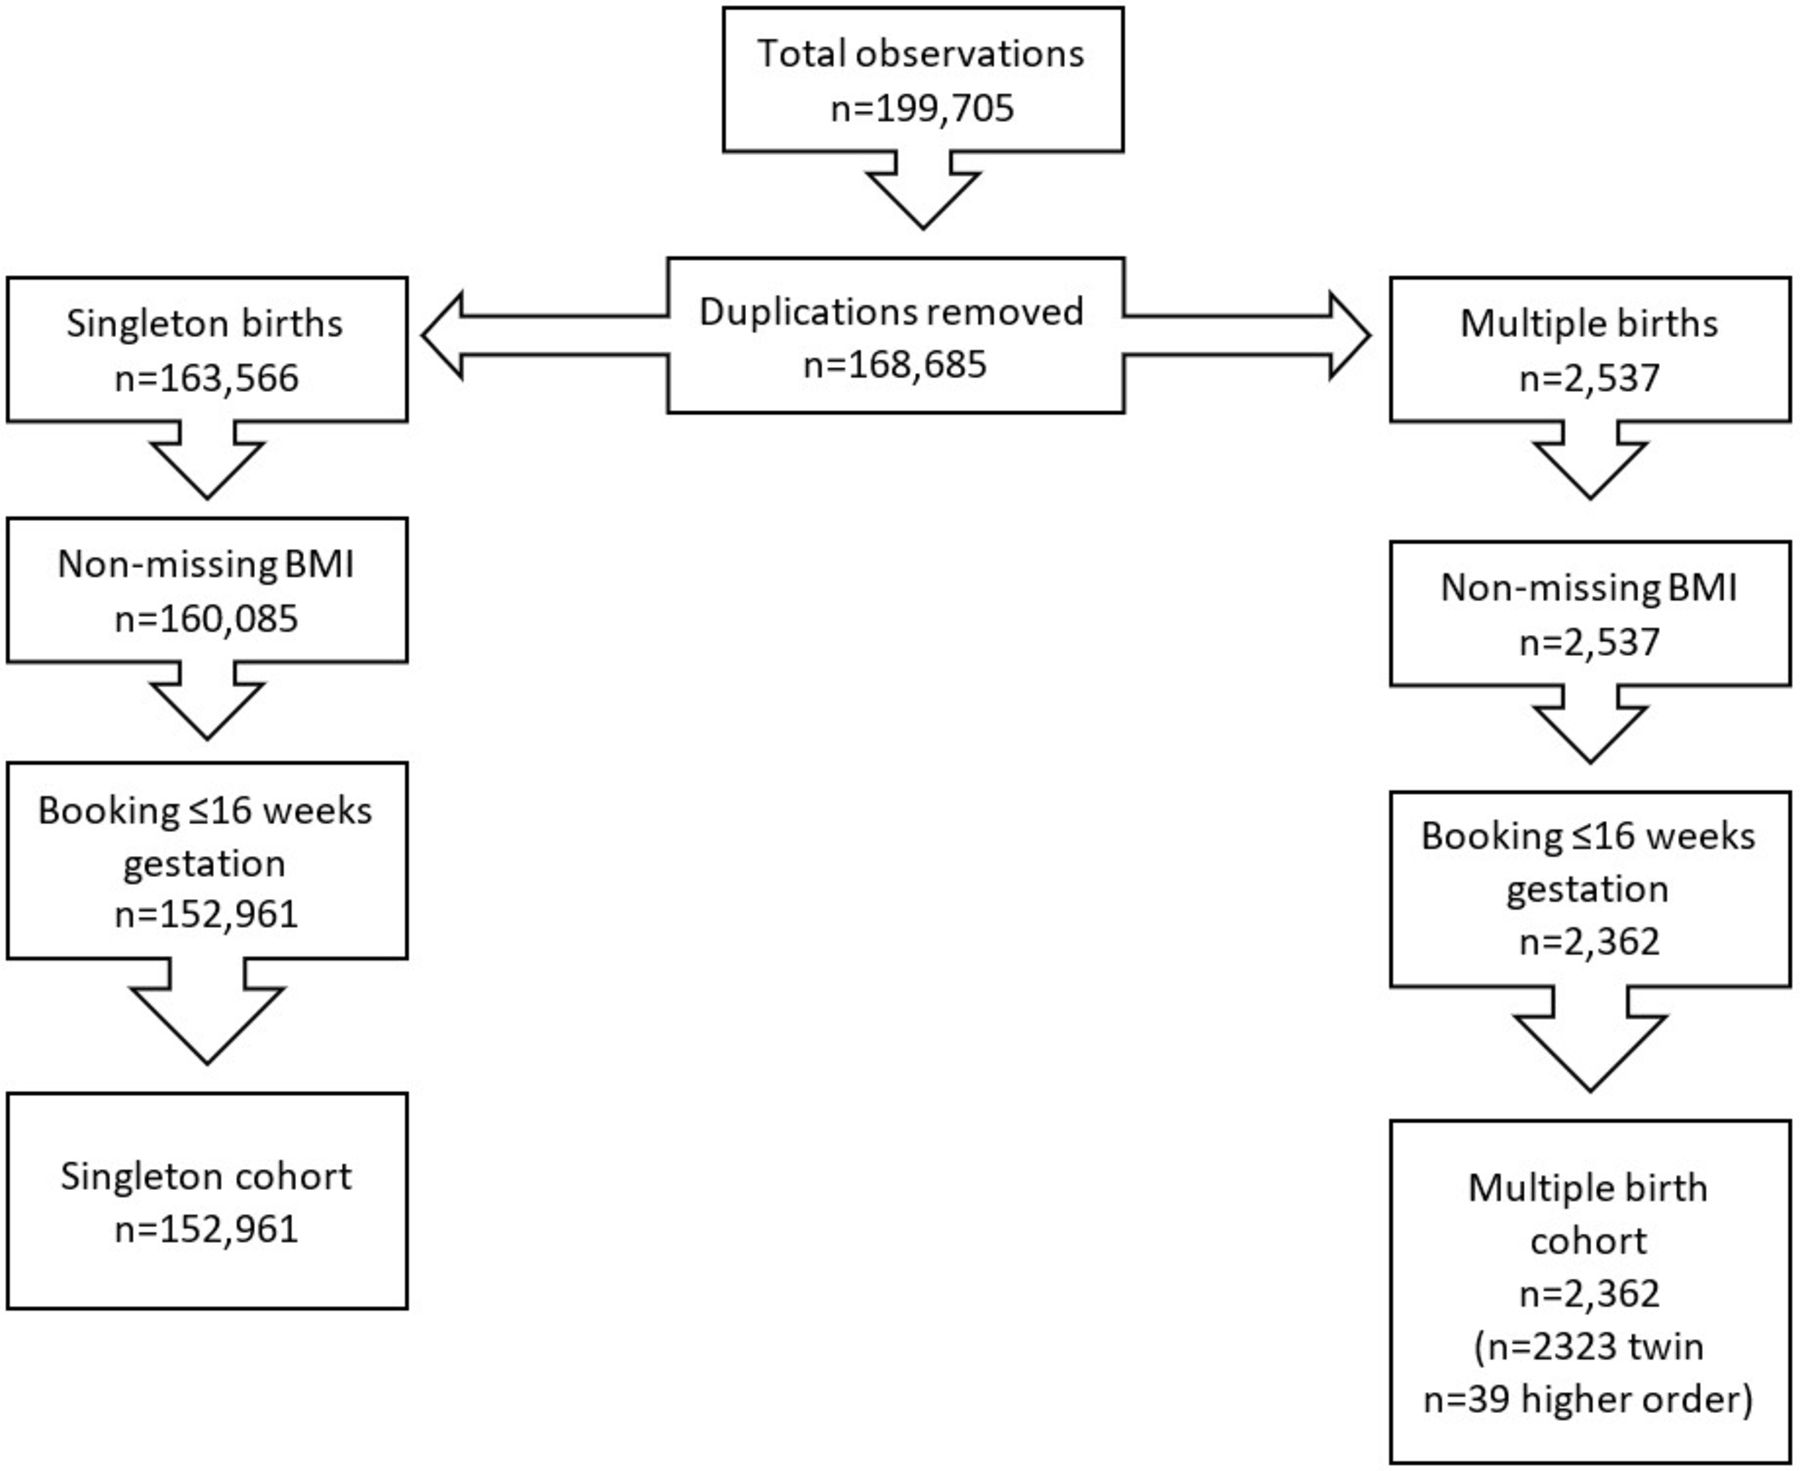
Selection of cases. BMI, body mass index.
Singleton pregnancies
Disparity in maternal demographics and clinical characteristics across BMI categories
Around half of women were classified as overweight or obese in early pregnancy, with approximately one in five women classified as obese. Statistically significant differences were seen across BMI categories for all characteristics. Mothers categorised as obese were significantly older (40+ years), parous, more likely to be unemployed and reported more unplanned pregnancies. Mothers in the underweight category demonstrated significantly greater rates of unemployment compared with the normal BMI cohort, were younger (aged 13–19 years), more likely to have an unplanned pregnancy and showed a greater reported history of psychiatric illness. Most women in the dataset had a white ethnic background (79.3%). The percentage of women with ethnicity other than white reduced as BMI category increased (tables 1 and 2).
Maternal demographics of singleton pregnancies
Maternal clinical characteristics of singleton pregnancies recorded at booking visit
Self-reported alcohol abstinence was greater than 99% across all BMI categories and the small but statistically significant differences across categories are unlikely to be clinically significant. Smoking rates differed significantly across BMI categories and ranged from 13% to 25%, with the underweight group having the highest rate. Women in the normal BMI category reported the highest rates of having never smoked, with the rates decreasing as BMI category increased. Self-reported folic acid supplementation increased slightly as BMI category increased.
Maternal history of hypertension increased significantly from 1.8% in the normal BMI cohort to 12% in the obese III cohort. This was reflected by a statistically significant increase in blood pressure as category of BMI increased, with close to a 20 mm Hg difference in systolic pressure and a 12 mm Hg difference in diastolic pressure across BMI categories. We also noted that women entered pregnancy with additional comorbidities as their BMI class increased. Type 2 diabetes mellitus increased exponentially from 0.04% in the normal weight class to 1.29% in the obese III class (p<0.001). Type 1 diabetes mellitus, was statistically higher in the overweight and obese categories compared with the normal BMI category. A previous history of transient ischaemic attacks or stroke also showed a trend towards increasing prevalence across BMI categories; however, the numbers were small and the differences did not reach statistical significance. The presence of mental health conditions increased from 5.04% in the normal weight class to 11.76% in obese II class.
Social deprivation and geography is associated with maternal overweight and obesity
Higher BMI was significantly associated with greater maternal deprivation (table 3). In the most deprived areas, more women were underweight (2.6%) or obese (22.8%) compared with those living in the least deprived areas (underweight: 1.9%, obese: 15.7%). A smaller percentage of women from the most deprived areas entered pregnancy within the normal BMI category (45.5%) compared with the least deprived areas (53.3%). Of note, the prevalence of women in obese class III in the most deprived areas approached double of that in the least deprived (3.0% vs 1.6%). These trends persisted when evaluated by individual deprivation domains (online supplemental table S1).
Supplemental material
Percentages of women in each BMI category according to deprivation quintile and rurality
Figure 2 demonstrates the complex relationship between deprivation and prevalence of overweight and obesity. A greater number of urban areas (blue) are clustered at either end of the scale of deprivation, while rural areas (green) demonstrate a clustering of deprivation levels in midrange. Both rural and urban areas demonstrate an average prevalence of overweight and obesity of over 50% from the first to third quintile of deprivation, before a steeper decline in prevalence moving into the fifth, or least deprived, quintile. Across all areas, the prevalence ranges from 22% to 69%.
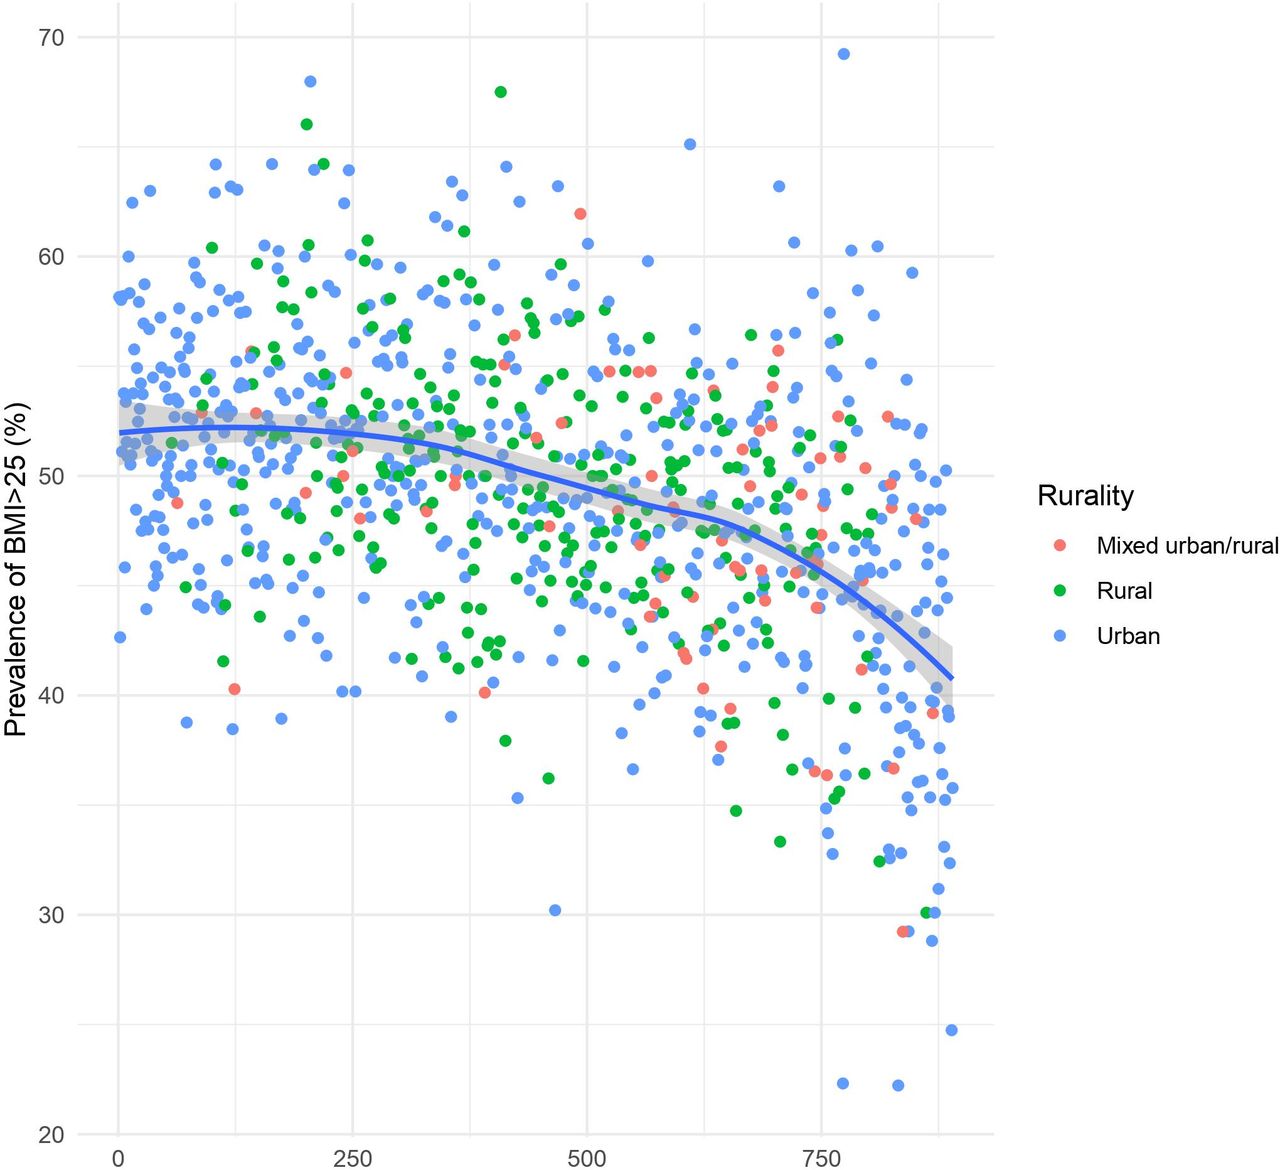
Prevalence of maternal overweight and obesity versus Northern Ireland multiple deprivation measure (1=most deprived; 890=least deprived). BMI, body mass index.
Geographical visualisation of prevalence of maternal overweight and obesity is available in the online supplemental figure S1. Prevalence differs markedly across Northern Ireland, with areas of greater prevalence scattered across the region and particularly apparent in the Western regions, where deprivation levels are greater. While a small belt of lower prevalence is observed in areas of lower deprivation surrounding Northern Ireland’s capital city, Belfast.
Supplemental material
Prevalence of maternal overweight and obesity is increasing
Between 2010 and 2017, there has been a marked decrease in the percentage of women entering pregnancy in the normal weight category (50.8%–45.6%) (figure 3; online supplemental table S2). This is associated with an increase in percentage of women in categories obese I (11.9%–13.3%), obese II (4.2%–6.4%) and obese III (2.3%–2.8%).
Supplemental material

Trends in BMI class between 2010 and 2017 in singleton pregnancies. BMI, body mass index.
The unadjusted linear model showed that per calendar year, maternal BMI in Northern Ireland was higher by on average 0.11 kg/m2 (95% CI: 0.096 to 0.123; p<0.001) (table 4). An extended model showed that per calendar year, BMI was higher by on average 0.10 kg/m2 (95% CI: 0.086 to 0.114; p<0.001), after adjusting for age and number of previous pregnancies. The full model which included age, previous births, planned pregnancy, employment status and ethnicity showed an increase of 0.134 kg/m2 (95% CI: 0.118 to 0.151; p<0.001).
Increase in BMI recorded at booking appointment per calendar year
Multiple pregnancies
Similar to the singleton cohort, over half of women with a multiple pregnancy were overweight or obese. Compared with singleton pregnancies, the prevalence of women who were overweight was slightly higher at 31%, however, prevalence of obesity appeared to be slightly lower in the multiple birth cohort (online supplemental table S3).
Supplemental material
Overall, women in the multiple pregnancy cohort were older than women in the singleton cohort. When age was dichotomised into two groups (<30 years vs 30+ years), advanced maternal age appeared to be more associated with the normal and overweight categories. Mothers who were overweight or obese were statistically more likely to be unemployed, parous and have an unplanned pregnancy. The percentage of white ethnicity was lower in the multiple birth cohort compared with the singleton cohort across all BMI categories. However, no significant differences in ethnicity were detected across BMI categories. Due to small numbers, rates of alcohol abstinence cannot be presented across BMI categories. Self-reported folic acid supplementation ranged from 91.7% to 95.8% across BMI categories, and differences were not significant.
Due to small counts, associations between BMI category and history of hypertension, type 1 and 2 diabetes mellitus and TIA/stroke are not presented. Both systolic and diastolic blood pressure increased across BMI categories, and also appeared to be higher compared with the women in the singleton cohort across all categories. History of psychiatric illness was demonstrated to have a relationship with BMI category, similar to that in the singleton cohort.
No discernible trends over time were detected in prevalence of overweight or obesity among women with multiple pregnancies (online supplemental table S4), however, this could reflect the lower numbers in the cohort.
Supplemental material
Discussion
Main findings
These results uniquely characterise a large pregnancy cohort over time. Reflecting trends elsewhere, a high prevalence of maternal overweight and obesity in Northern Ireland is apparent. Worryingly, the prevalence of obesity is increasing at a fast rate. Our results demonstrate a greater prevalence of obesity compared with a previous study in a large regional maternity hospital in the same UK region conducted in 2004–2011.8 In the current study, there is a large decrease (52.5%–45.6%) in women entering pregnancy with a BMI in the normal range, and conversely increases in overweight (27.8%–29.9%) and obesity (16.9%–22.5%).
Interpretation
We have identified links between maternal obesity and other medical comorbidities, including, hypertension, diabetes mellitus and history of psychiatric illness. Strategies to optimise the health of mothers entering pregnancy are urgently needed. The importance of preconception care is widely acknowledged, and further research to support implementation of evidence-based interventions is required.41 The presence of obesity and multiple comorbidities has been shown to be linked to a higher risk of severe maternal morbidity and mortality, and increased cost to healthcare.42 Furthermore, there is evidence that the effects of pre-pregnancy obesity on offspring are independent of gestational weight gain.43 This suggests that effects of lifestyle interventions during pregnancy may be limited. Optimisation of health prior to pregnancy in relation to management of chronic conditions, nutrition and lifestyle behaviours could improve maternal and child health across the lifespan.43 Our study has shown that self-reported pregnancy intention rates were high across all cohorts (67%–71%). This may represent a vital opportunity to implement preconception care aimed at managing obesity, comorbidities and other lifestyle behaviours.43
This study is the first of its kind to highlight the impact of low BMI. In this cohort, women who entered pregnancy underweight were more likely to be younger, have fewer previous pregnancies, be unemployed and have a history of psychiatric illness. These associations also highlight that, in addition to preconception care, there are cohorts of younger primiparous women who could benefit from focused postpartum care to optimise health prior any subsequent pregnancies.
In terms of health-related behaviours, smoking rates in our population were relatively high compared with the UK and Ireland, at 14.4% for the whole singleton group.44 45 This further highlights the need for counselling about the risks posed by behaviours that impact their health.
This study also adds to evidence concerning multiple pregnancies, an area often neglected in obstetric research. Our results highlight important findings in this population concerning the high rates of overweight and obesity and its association with demographic characteristics such as advanced maternal age, unemployment and unplanned pregnancy, and with rate of comorbidities such as hypertension and psychiatric illness. There were higher rates of unplanned pregnancy in the overweight and obese categories and, compared with the singleton cohort, obesity rates appeared to be lower. These findings may be in part explained by advice for having a BMI less than 30 for successful in vitro fertilisation treatment, which is known to be associated with multiple pregnancies; a relationship that further research might elucidate.46 There is a need for researchers to better describe the multiple pregnancy population to optimise our understanding of obesity in these pregnancies and inform how best to counsel women, for example, regarding appropriate gestational weight gain.
Northern Ireland is the most deprived of the four UK nations, with 37% of the population living in areas ranked most deprived fifth of UK, and with none of the population (0%) living in the least deprived fifth of the UK.34 This study builds on the existing literature, by demonstrating the complex non-linear relationship between deprivation and maternal BMI. The majority of geographical areas in this study demonstrate high percentages of overweight and obesity. The steep decline in prevalence in the fifth quintile demonstrates that only a small proportion of the least deprived areas are relatively spared the negative effects of deprivation. This may reflect the distribution in Northern Ireland’s deprivation in absolute terms. The locality of the areas with the lowest prevalence is striking in terms of their proximity to each other and to the largest city in Northern Ireland. The areas are almost exclusively contained within a small area where deprivation is at its lowest, forming a ‘belt of health and wealth’.
A significant proportion of women are entering pregnancy with increased BMI and other comorbidities. Primary care should support couples of childbearing age in making positive changes to nutrition and lifestyle behaviours affecting weight and management of chronic conditions.32 In order to improve maternal and child outcomes, there is a need for future primary health research focusing on developing and evaluating preconception and inter-pregnancy strategies in the community to optimise health prior to pregnancy.
This study contributes to epidemiological understanding of maternal overweight and obesity. It involved use of a large country-wide dataset, and is the first of its kind in the Northern Ireland maternity population. In our use of routinely collected healthcare data, we have observed trends in maternal BMI over time, as well as associations with a range of demographic characteristics and comorbidities. The size of the dataset has also allowed for subgroup analyses for both singleton and multiple pregnancy cohorts.
The ability to link healthcare data to official measures of deprivation and spatial data has allowed for detailed analysis and visualisation of the relationships between health, and deprivation and geography. It has also allowed the team to establish a rich resource of data and code which can be built on over time and made available for further research.
A further strength of this study is the use of directly measured BMI at an early stage of pregnancy. Many other studies rely on self-reported pre-pregnancy BMI, which has previously been shown to misclassify BMI in over 13% of cases.47 In particular, overweight and obese categories tend to be under-reported, therefore underestimating prevalence in such studies. Typically, the first scheduled antenatal visit is ≤10 weeks gestation with a midwife.48 For the purpose of this study, pregnancies with a measured BMI ≤16 weeks gestation were included. There is evidence to suggest that pregnancy related weight gain before 18 weeks gestation is modest.49 In addition, retrospective analysis of routinely collected healthcare data from maternity units across the UK highlights the complex links between maternal women obesity and delayed timely access to obstetric care.50 Therefore, the choice of 16 weeks as a cut-off for inclusion in this study represents a compromise; it is later than recommended for first access to antenatal care (ie, booking appointment) in order to capture women who may have delayed access to maternity care, but before the steeper pregnancy related weight gain typically occurs.
For many characteristics, differences were remarkable between the BMI categories. For some, however, for example proportions of mothers abstaining from alcohol, statistical tests returned significant results for small differences. Clinical judgement should be employed when interpreting these smaller differences. Additionally, data for some variables, for example smoking and alcohol intake, are obtained by self-report and may therefore be under-reported.
We ensured that our cohorts reflected the true obstetric population. Other reports commonly select only one pregnancy per mother in a given time period. In our study, a proportion of mothers contributed more than one pregnancy. Had the study reported only the initial pregnancy for each mother, prevalence of obesity may have been lower as those with interpregnancy weight gain would have been excluded.
The study also highlights the challenges faced when using routinely collected data. As an example, small numbers in ethnic groups other than white necessitated the combining of these ethnicities into one group. This reflects the largely white population of Northern Ireland. Although statistically appropriate, this, however, meant that we were unable to adjust the cut-off points for BMI categories according to ethnicity to accurately reflect natural differences in anthropometrics. It also hinders our understanding of the distribution of BMI across cohorts of women who may be at increased risk of poor maternal and neonatal outcomes. Additionally, caution should be employed when interpreting p values associated with some small counts in the multiples cohort.
Conclusion
Clear patterns emerged from this comprehensive regional dataset which demonstrates marked disparity in maternal deprivation and clinical characteristics across BMI categories. Women who are overweight or obese are entering pregnancy with additional comorbidities and the prevalence of overweight and obesity is increasing. Improved understanding of population demographics and the burden of multimorbidity in pregnancy will help inform future preconception health strategies and public health campaigns.
Data availability statement
No data are available.
Ethics statements
Patient consent for publication
Ethics approval
Anonymised data were obtained via the Honest Broker Service with ethical approval obtained from the Honest Broker Service Governance Board.
Acknowledgments
The authors would like to acknowledge the help provided by the staff of the Honest Broker Service (HBS) within the Business Services Organisation Northern Ireland (BSO). The HBS is funded by the BSO and the Department of Health, Social Services and Public Safety for Northern Ireland (DHSSPSNI). The authors alone are responsible for the interpretation of the data and any views or opinions presented are solely those of the author and do not necessarily represent those of the BSO.
References
Supplementary materials
Supplementary Data
This web only file has been produced by the BMJ Publishing Group from an electronic file supplied by the author(s) and has not been edited for content.
Footnotes
Twitter @LisaKent_QUB, @K_AEastwood
Contributors All authors contributed to the design, analysis and preparation of the manuscript. KAE is responsible for the overall content as guarantor.
Funding Scholarships Committee, School of Medicine, Dentistry and Biomedical Sciences, Queen’s University Belfast.
Map disclaimer The depiction of boundaries on the map(s) in this article does not imply the expression of any opinion whatsoever on the part of BMJ (or any member of its group) concerning the legal status of any country, territory, jurisdiction or area or of its authorities. The map(s) are provided without any warranty of any kind, either express or implied.
Competing interests None declared.
Provenance and peer review Not commissioned; externally peer reviewed.
Supplemental material This content has been supplied by the author(s). It has not been vetted by BMJ Publishing Group Limited (BMJ) and may not have been peer-reviewed. Any opinions or recommendations discussed are solely those of the author(s) and are not endorsed by BMJ. BMJ disclaims all liability and responsibility arising from any reliance placed on the content. Where the content includes any translated material, BMJ does not warrant the accuracy and reliability of the translations (including but not limited to local regulations, clinical guidelines, terminology, drug names and drug dosages), and is not responsible for any error and/or omissions arising from translation and adaptation or otherwise.