Article Text

Abstract
Objectives To evaluate the capacity of general practice (GP) electronic medical record (EMR) data to assess risk factor detection, disease diagnostic testing, diagnosis, monitoring and pharmacotherapy for the interrelated chronic vascular diseases—chronic kidney disease (CKD), type 2 diabetes (T2D) and cardiovascular disease.
Design Cross-sectional analysis of data extracted on a single date for each practice between 12 April 2017 and 18 April 2017 incorporating data from any time on or before data extraction, using baseline data from the Chronic Disease early detection and Improved Management in PrimAry Care ProjecT. Deidentified data were extracted from GP EMRs using the Pen Computer Systems Clinical Audit Tool and descriptive statistics used to describe the study population.
Setting Eight GPs in Victoria, Australia.
Participants Patients were ≥18 years and attended GP ≥3 times within 24 months. 37 946 patients were included.
Results Risk factor and disease testing/monitoring/treatment were assessed as per Australian guidelines (or US guidelines if none available), with guidelines simplified due to limitations in data availability where required. Risk factor assessment in those requiring it: 30% of patients had body mass index and 46% blood pressure within guideline recommended timeframes. Diagnostic testing in at-risk population: 17% had diagnostic testing as per recommendations for CKD and 37% for T2D. Possible undiagnosed disease: Pathology tests indicating possible disease with no diagnosis already coded were present in 6.7% for CKD, 1.6% for T2D and 0.33% familial hypercholesterolaemia. Overall prevalence: Coded diagnoses were recorded in 3.8% for CKD, 6.6% for T2D, 4.2% for ischaemic heart disease, 1% for heart failure, 1.7% for ischaemic stroke, 0.46% for peripheral vascular disease, 0.06% for familial hypercholesterolaemia and 2% for atrial fibrillation. Pharmaceutical prescriptions: the proportion of patients prescribed guideline-recommended medications ranged from 44% (beta blockers for patients with ischaemic heart disease) to 78% (antiplatelets or anticoagulants for patients with ischaemic stroke).
Conclusions Using GP EMR data, this study identified recorded diagnoses of chronic vascular diseases generally similar to, or higher than, reported national prevalence. It suggested low levels of extractable documented risk factor assessments, diagnostic testing in those at risk and prescription of guideline-recommended pharmacotherapy for some conditions. These baseline data highlight the utility of GP EMR data for potential use in epidemiological studies and by individual practices to guide targeted quality improvement. It also highlighted some of the challenges of using GP EMR data.
- electronic health records
- general practice
- chronic disease
- diabetes mellitus
- cardiovascular diseases
Data availability statement
Data are available on reasonable request. The datasets generated and analysed during this study are not publicly available due to stipulations within the ethics approval, but are available from the corresponding author on reasonable request subject to ethics approval.
This is an open access article distributed in accordance with the Creative Commons Attribution Non Commercial (CC BY-NC 4.0) license, which permits others to distribute, remix, adapt, build upon this work non-commercially, and license their derivative works on different terms, provided the original work is properly cited, appropriate credit is given, any changes made indicated, and the use is non-commercial. See: http://creativecommons.org/licenses/by-nc/4.0/.
Statistics from Altmetric.com
Key points
Question
This article explores the use of general practice electronic medical records (GP EMRs) to assess risk factor detection and disease diagnostic testing, diagnosis, monitoring and pharmacotherapy for the interrelated chronic vascular diseases: chronic kidney disease, type 2 diabetes and cardiovascular disease.
Finding
This research finds that GP EMRs can be used to identify patients who do not have: risk factor assessment, disease testing, coded diagnoses (where there are biochemical indicators of disease) and disease management as per recommendations. It provides epidemiological data on the interrelated chronic vascular diseases in a GP population in Victoria, Australia.
Meaning
This research highlights the utility of GP EMR data to identify areas that may be able to be improved. As part of the development of an electronic tool, a subsequent prospective analysis will assess the use of GP EMR data by practices to tailor quality improvement projects to their needs as part of an electronic technology tool-based intervention.
Introduction
Chronic kidney disease (CKD), type 2 diabetes (T2D) and cardiovascular disease (CVD) (including ischaemic heart disease (IHD), heart failure (HF), ischaemic stroke (IS) and peripheral vascular disease (PVD)) are common interrelated chronic vascular diseases sharing multiple risk factors as well as preventive and management strategies.1 Effective detection and management of the rising numbers of affected individuals presents a considerable challenge. In 2012, over one in four Australian adults had at least one of these diseases2 and they were the principal or associated cause of over 60% of all deaths in Australia.3 The increasing prevalence of chronic disease together with an ageing population is causing considerable pressure on the Australian healthcare system.4
In order to reduce this high disease burden and associated expenditure, detection and management of these diseases and their risk factors needs to be optimised. The interrelated chronic vascular diseases share risk factors, and in some cases, the presence of one of these diseases can lead to another. Early detection and management of risk factors and diseases offers the possibility of preventing this cascade of events. This is especially important in high-risk groups, such as those with familial hypercholesterolaemia (FH), atrial fibrillation (AF) and in Aboriginal and Torres Strait Islander peoples. FH is the most common autosomal dominant condition which leads to premature CVD if untreated.5 AF greatly increases the risk of stroke, with this risk able to be reduced with anticoagulants in those at higher risk.6 Aboriginal and Torres Strait Islander peoples have 2.2 times the risk of CKD, 3.6 times the risk of diabetes and 1.3 times the risk of CVD compared with non-Indigenous Australians.7 Recommendations addressing these interrelated chronic vascular diseases advise targeted testing to identify and appropriately manage individuals with, and at risk of, these conditions in general practice (GP).8 9 However, previous studies have demonstrated that the interrelated chronic vascular diseases and their risk factors may be under-recognised and undertreated in the community10–12 reflecting the challenges of guideline implementation.
Primary care provides the best setting to translate the national recommendations for management of these chronic diseases. Around 85% of Australians attend GP each year.4 In Australia, patients do not need to register to attend a GP and are able to attend multiple different practices, with 28% attending more than one practice in a year.13 Over 95% of Australian general practitioners use computers for clinical purposes and of these, more than two-thirds use electronic medical records (EMRs) exclusively.14 A previous study from our centre suggested that GP EMR data could be used to inform quality improvement in the translation of guidelines and recommendations in the setting of CKD.15 Research from Western Australia has shown the potential for GP EMR data to detect patients with undiagnosed FH.16 A large Australian study using GP EMR data from 6.6% of Australian GPs with participants from all states and territories, showed prevalence of hypertension at 16.9%, T2D at 5.3%, CKD at 1.2%, HF at 1.2%, AF at 2.3% and CVD (including IHD, PVD, IS and transient ischaemic attack) at 5%.17 This study included all patients with at least one general practitioner clinical encounter within a 12-month period, whereas our study required patients to have had ≥3 GP attendances within a 24-month period. There is a paucity of published data from Australian GP EMRs regarding the prevalence and management of IHD, IS and PVD as individual conditions instead of being reported together as CVD and our study addresses these issues. The aim of this cross-sectional analysis was to evaluate the capacity of EMR data from Victorian GPs to assess the recording of risk factors, disease diagnostic testing, diagnosis, monitoring and pharmacotherapy for the interrelated chronic vascular diseases by reporting baseline data from the Chronic Disease IMPACT (Chronic Disease early detection and Improved Management in PrimAry Care ProjecT) study.
Methods
A convenience sample of practices were selected for invitation to participate based on recommendations from Primary Health Networks (PHNs), a hospital-based GP advisor, other general practitioners known to study staff or from participation in a previous study targeting the improved detection and management of CKD.15
Inclusion criteria for practices were as follows: Located in Victoria, Australia; >2000 patients with an EMR in the practice; existing licence for the Pen Computer Systems Clinical Audit Tool or willingness to instal the necessary software; no participation in other quality improvement projects with goals overlapping with Chronic Disease IMPACT; use of the same EMR system (Medical Director, Best Practice or Zedmed) over the preceding 2 years. Patients were included in the data extraction if they were aged ≥18 years and had attended their GP≥3 times within the preceding 24 months. In the Australian setting, in which patients can attend multiple GPs, including only patients that have attended ≥3 times within the preceding 24 months reduces the risk of counting the same patient twice, as a patient would not be captured if attending a practice only rarely (and this study was not able to check for duplication). It is likely that there would only be few patients who have attended more than one practice ≥3 times over the past 24 months (for whom multiple practices would need to assess/manage any chronic conditions) and so this would make minimal difference to the overall results. Patients were included in the study regardless of whether or not they had any of the risk factors or conditions assessed within the study.
The assessed variables in this study consist of: risk factor assessment, risk factor presence, chronic disease diagnosis, presence of pathology tests indicating possible chronic disease without a documented diagnosis and chronic disease monitoring/management. Details of how these variables have been defined are provided in a supplementary methods section in the online supplemental appendix.
Supplemental material
Deidentified patient data were extracted from the EMRs on a single date for each practice between the 12th and the 18th of April 2017 using Pen Computer Systems Clinical Audit Tool. Although the data from each practice were extracted on a single date in April 2017, the study considered all relevant data items for included patients up to and including that date. This data extraction tool was unable to assess scanned documents or free text written in progress notes, but it was able to extract coded diagnostic data used by the different EMR systems: Pyefinch for Best Practice, Docle for Medical Director and ICPC2-Plus for Zedmed. It extracted medication generic and brand names provided by the different EMRs, and extracted both LOINC and pathology test names used by laboratories. Medications prescribed by external providers would need to be entered into the EMR by general practitioners in order for them to be identified by the data extraction tool. Pathology tests were only included if results were sent electronically from the laboratory to the EMR, not if only scanned hard copies were available. This study was not able to assess how much data would have been available in scanned documents or free text had this been accessible. All the EMRs used in this study were able to record each of the variables assessed in this study and the data extraction tool could extract these data, provided they were entered in the designated location (eg, diagnoses entered from a drop-down list into the diagnosis list). Practices were presented with reports presenting graphs comparing measures from their own practice to the average from other practices in the project and had opportunity to report any findings out of keeping with their expectations so that data discrepancies could be interrogated and corrected.
Baseline data (data collected at the start of the larger project (Chronic Disease IMPACT)) were extracted from GP EMRs and then analysed. The prevalence of assessed variables is reported using partial pooling estimates. A Bayesian hierarchical logistic model with a random intercept per practice was utilised. This approach allows simultaneous estimation of the variability between practices, of the overall mean, and to predict what range of prevalence is likely to be observed in a new practice. The latter is expressed as a 95% credible interval on new practices, which combines the statistical uncertainty given finite sample size with the variability between practices; it assumes similarities between practices but that practices do not operate identically. We used partial pooling to estimate the grand mean, that is the average percentage across practices, implicitly adjusting for practice size. Two credible intervals are provided: the credible interval on the grand mean itself, and a credible interval for the true percentage of hypothetical new practice. If there were no variation between practices, then the two intervals would be identical, however, in general we observe variation between practices above pure stochastic variation and the credible interval for the new practice is wider than that for the grand mean. All outcomes were analysed separately. Analysis was performed using R V.3.5.1 and the rstanarm library.
Algorithms were applied to the data to determine whether or not a patient was being tested/treated according to national guidelines5 8 9 18–21 (or US guidelines if Australian guidelines not available22 23). Algorithms were not always able to exactly reflect guidelines due to limitations in the data available for this study; these modifications are listed in online supplemental table 1.
The code used for statistical analysis has been published in an online repository and can be accessed with the following link: https://bitbucket.org/julia_jones/cd_impact_baseline/src/master/
A more extensive outline of the methodology is included in online supplemental appendix.
Results
Fourteen practices were approached from the North Western Melbourne and Murray PHN catchments; nine consented to participate. Of these, one was excluded from analysis after it was determined that data were significantly compromised due to a practice merge. The five practices that declined stated that this was due to time restrictions. Hereafter, only the eight included practices are discussed.
The eight practices were located between 12 and 165 km from the centre of Melbourne. Using the Australian Statistical Geography Standard classification, 2016; five practices were from city areas. Of these, one was classified as inner metropolitan, three outer metropolitan, and one was beyond the outer metropolitan area boundary. Three practices were from inner regional areas. Six practices were privately owned and two had corporate ownership. Two practices used bulk-billing (government funding of appointments with no out-of-pocket cost to patients) exclusively, while the others charged some patients additional fees on top of the government funding. All practices had index of relative socioeconomic disadvantage scores (based on their statistical area level 1 location) in the lowest four quintiles with scores ranging from the 9th to the 76th percentile within Australia, with 5 of the practices below the 50th percentile.24 Practices ranged in size from having a total of 1632–9427 eligible patients. All but one practice had at least one practice nurse, and a practice nurse or practice manager was delegated to championing the implementation of the project at each site.
There were 37 946 eligible patients in the 8 practices included in the analysis. Mean (SD) age was 48 (±18) years and 15 031 (40%) were male.
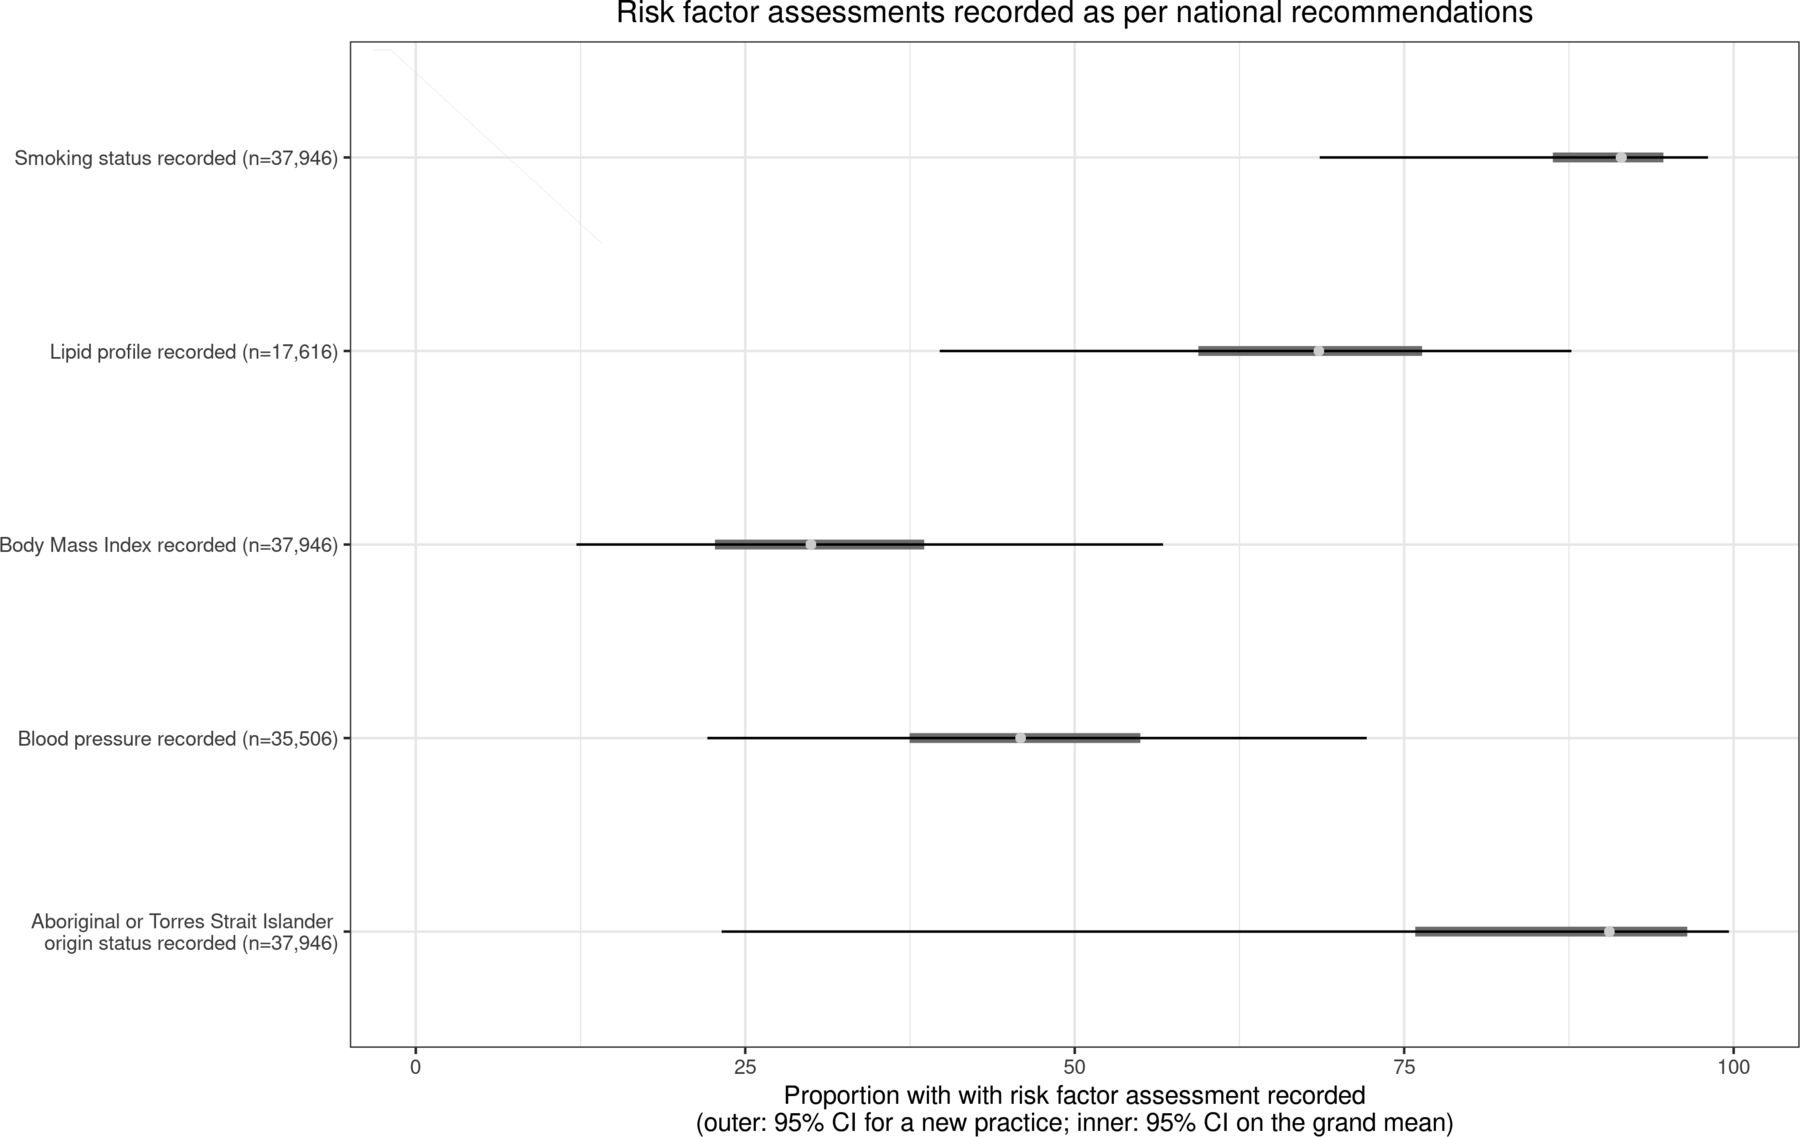
Documentation of risk factor assessment is presented in figure 1 (with further details in online supplemental table 2). The highest proportion of documented assessments were for smoking status, followed by Aboriginal and Torres Strait Islander origin, lipid profile, blood pressure and was lowest for body mass index (BMI).

Risk factor assessments recorded as per national recommendations.
Figure 2 (with further details in online supplemental table 3) presents those identified by the data extraction tool as having individual risk factors present; those who are at risk of the interrelated chronic vascular diseases; and those at risk with up-to-date testing for CKD and T2D. The diseases with the highest proportions of ‘at risk patients’ were CVD, followed by CKD and the lowest T2D.

Risk factor presence and disease testing in those at risk. CKD, chronic kidney disease; CVD, cardiovascular disease; T2D, type 2 diabetes.
The conditions with the highest proportions of patients with tests indicating a possible diagnosis (based on a single abnormal test, but with no formal coding) were CKD, followed by T2D and the lowest FH. The diseases with the highest proportions of coded diagnoses were T2D followed by IHD, CKD, AF, IS, HF, PVD and the lowest FH. The greatest overlap, for patients with more than one chronic disease diagnosis, was between CKD and T2D. Details of these results are in figure 3 (with further details in online supplemental table 4).
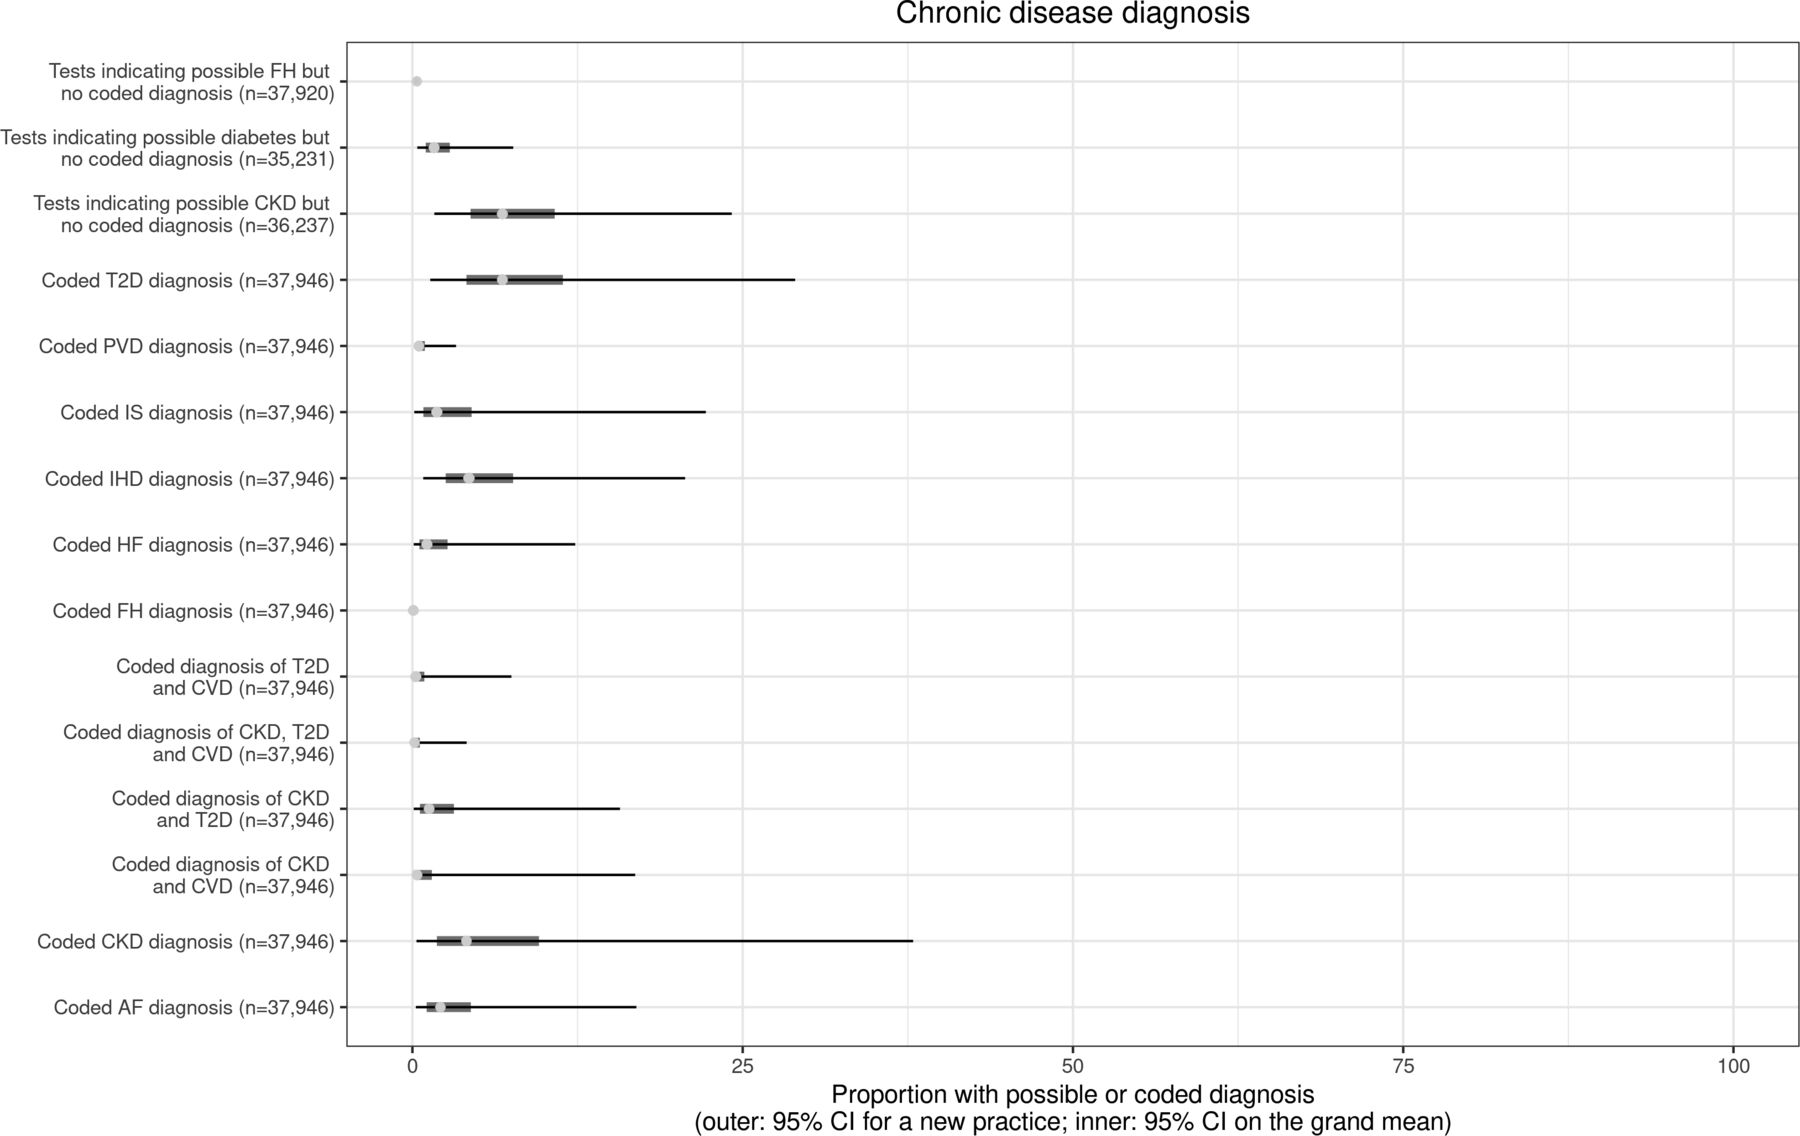
Chronic disease diagnosis. AF, atrial fibrillation; CKD, chronic kidney disease; CVD, cardiovascular disease; FH, familial hypercholesterolaemia; HF, heart failure; IHD, ischaemic heart disease; IS, ischaemic stroke; PVD, peripheral vascular disease; T2D, type 2 diabetes.
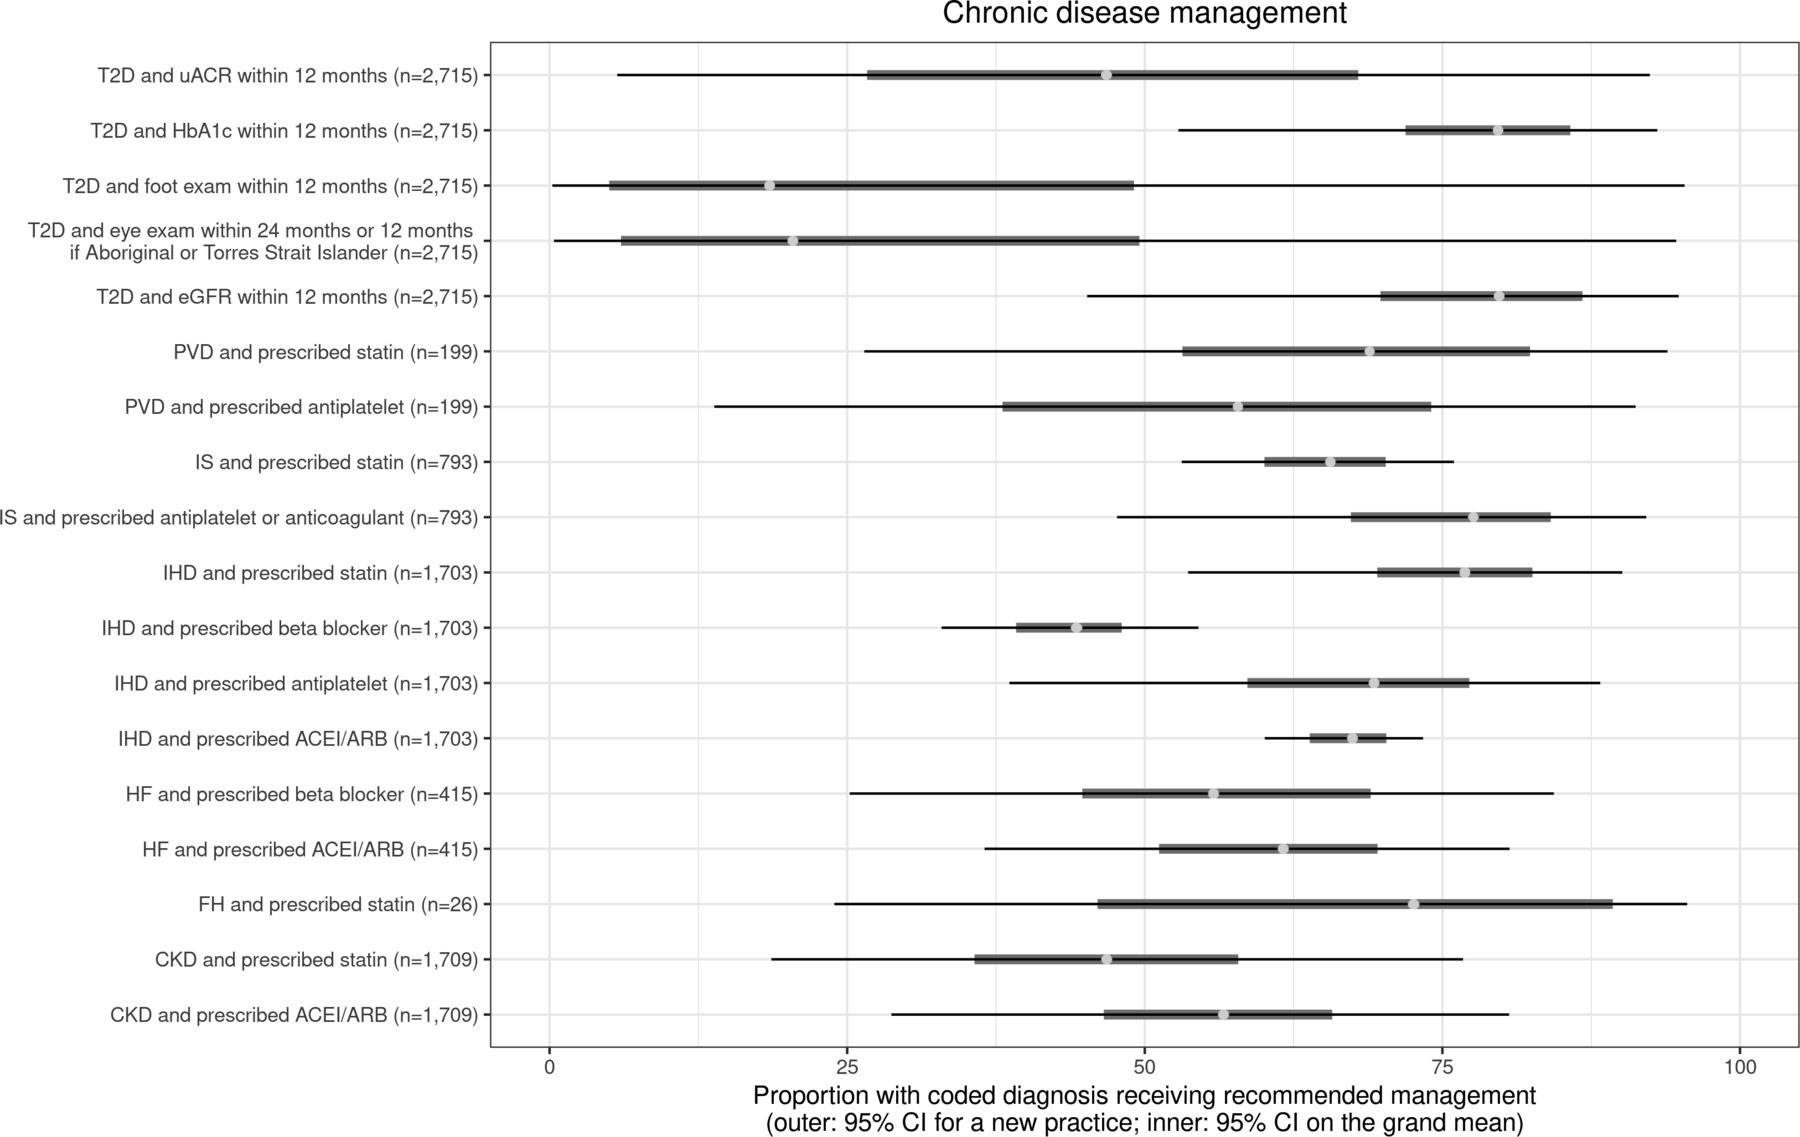
Prescriptions of recommended pharmacotherapies are presented in figure 4 (with further details in online supplemental table 5). The proportion of patients prescribed guideline-recommended medications ranged from 44% (beta blockers for patients with IHD) to 78% (antiplatelets or anticoagulants for patients with IS). Australian guidelines were used for all conditions except for PVD and AF, for which USA-based guidelines were used due to an absence of available Australian guidelines in 2017 (guideline details are in online supplemental table 5).

Chronic disease management. ACEI, angiotensin-converting enzyme inhibitors; ARB, angiotensin receptor blockers; CKD, chronic kidney disease; CVD, cardiovascular disease; eGFR, estimated glomerular filtration rate; FH, familial hypercholesterolaemia; HbA1c, glycated haemoglobin, HF, heart failure; IHD,ischaemic heart disease; IS, ischaemic stroke; PVD, peripheral vascular disease; T2D, type 2 diabetes.
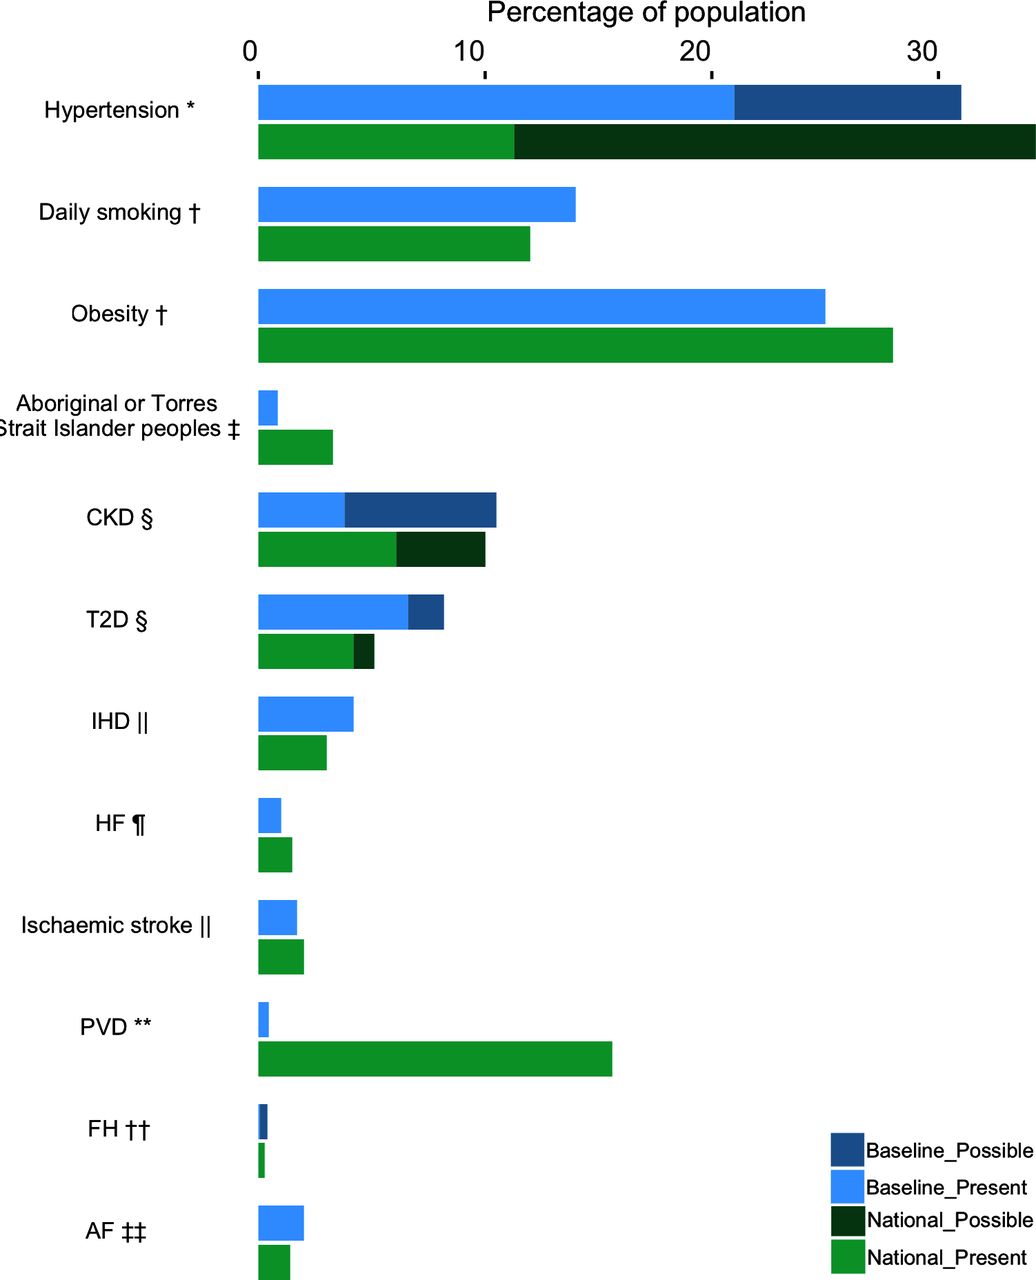
Comparison of the baseline data to Australian population health data is presented in figure 5. Study participants were patients attending Victorian GPs multiple times, rather than the Australian population at large. Study proportions were higher for coded diagnosis of hypertension and daily smoking, but lower for obesity. The study had a similar proportion of people of Aboriginal and Torres Strait Islander background as the Victorian population, which is lower than in Australia wide data. The study population had a lower proportion of diagnosed CKD, however, when patients with pathology tests indicating a possible diagnosis were combined with those with a coded diagnosis, there was a slightly higher proportion than in the Australian population at large. The study had a higher proportion of people with T2D, IHD and AF, a similar proportion with FH and a slightly lower proportion with HF and IS. It had a much lower proportion of people with PVD than the only pre-existing Australian data, which only included older men in Western Australia, so is not directly comparable.

Study population (partial pooling) compared with national prevalence. *National data from the Australian Bureau of statistics ‘Hypertension and measured high blood pressure—National Health Survey: First results, 2014–2015 health survey: first results, 2014–2015’.26 People who self-reported a diagnosis in the National data are considered to have the diagnosis present, a possible diagnosis occurred where measured blood pressure was elevated in a person who did not self-report the diagnosis. †National data from the Australian Institute of health and welfare.4 ‡National data from the Australian Bureau of statistics, ‘estimates of Aboriginal and Torres Strait Islander Australians, June 2016’.25 Note that estimated proportion of Aboriginal and Torres Strait Islander peoples in Victoria was 0.9%,25 much the same as the baseline data proportion at 0.84%. §National data from the Australian Bureau of statistics. ‘Australian health survey: biomedical results for chronic diseases, 2011–2012’.28 People who self-reported a diagnosis in the National data are considered to have the diagnosis present and if a pathology test is consistent with the disease being present in a person who does not self-report the disease, it is considered a possible diagnosis. ||National data from the Australian Institute of health and welfare. ‘Cardiovascular disease, diabetes and chronic kidney disease—Australian facts: prevalence and incidence’.2 ¶National data from a systematic review addressing prevalence of HF in Australia.31 **These data are from a study in Perth, Western Australia assessing men aged 65–83 years, not the general adult Australian population.34 There are currently no published data assessing PVD in the general adult Australian population. ††National data from a study analysing data from an unselected Australia-wide population found a prevalence of probable/definite FH of 1 in 353.32 In this graph all of these probable/definite national cases are considered to have the diagnosis present. ‡‡National data from a study analysing the AusDiab study population including participants ≥35 years of age.33 AF, atrial fibrillation; CKD, chronic kidney disease; FH, familial hypercholesterolaemia; HF, heart failure; IHD, ischaemic heart disease; PVD, peripheral vascular disease; T2D, type 2 diabetes.
Discussion
This baseline data demonstrated that GP real-life EMR data are able to identify many patients at risk of, requiring testing for, or with incomplete coding or treatment for many chronic diseases.
Risk
Risk factor assessment was well recorded for smoking status and whether or not a person was of Aboriginal or Torres Strait Islander origin. Lipid profile testing was often completed (69%) as per guidelines, however, only 30% had BMI and 46% blood pressure recorded according to recommended timeframes within an extractable field. These figures are of concern, however, this study was unable to determine how many patients had up-to-date BMI and blood pressure testing that was not entered in a manner that could be extracted by the data extraction tool, such as in free text in a progress note.
Risk factor prevalence in the study population was compared with national data, with an expectation that the study population prevalence would generally be higher than the national population, given that study patients had all attended GP at least three times within 2 years and the majority of practices were from areas with an index of relative socioeconomic disadvantage score below the 50th percentile. Overall, documented risk factor prevalence was reasonably similar for daily smoking and obesity when compared with national data.4 The proportion of people of Aboriginal or Torres Strait Islander background was similar to the Victorian population (which is lower than the proportion Australia wide).25 The study population had a higher proportion of diagnosed hypertension, but a lower proportion in the group combining those with a possible or known diagnosis of hypertension, compared with national data.26 Given that the study population did not have a notably higher risk factor prevalence and that our study found a substantial number of missing risk factor assessments, it is likely that the EMR data have not identified all patients at risk and that true risk factor prevalence in the included practices exceeds study prevalence.
Specific to hypertension, a possible diagnosis (with no coded diagnosis recorded) was based on a single blood pressure reading, whereas diagnosis requires two abnormal readings on separate days, potentially leading to excess possible cases being identified in this study. However, national hypertension data are also based on measurements from a single day.27 People with normal blood pressure readings while taking antihypertensives, without a coded diagnosis of hypertension (who may have been prescribed antihypertensives for other reasons, eg, HF or angina) were not considered to have hypertension in our study, potentially underestimating hypertension in our results.
Many but not all patients at risk were able to be identified from the EMR using the data extraction tool and an opportunity exists to further improve risk detection with quality improvement strategies addressing EMR usage, for example, recording height, weight and blood pressure in extractable section of EMR.
Detection/testing
Populations at risk of CKD and T2D were found to have low levels of testing within the recommended timeframes for these diseases, at 17% for CKD and 37% for T2D. Potential contributors include pathology tests having been done elsewhere (eg, specialist clinics or other GPs), tests being on paper based records and issues with pathology coding leading to pathology results not being extractable from the EMR. In some cases, by reviewing all codes being used by included pathology companies for the tests, we identified codes that were missing from the data extraction tool. Missing pathology tests were then incorporated into the data after additional codes were added to the data extraction tool. Standardised pathology coding would facilitate EMR based audit, decision support tools and other quality improvement initiatives as well as offering benefits for research.
Coding/diagnosis
There was a gap between expected numbers of patients with diagnoses (based on pathology tests suggesting possible diagnoses) and numbers recorded with coded diagnoses for chronic conditions. This was most marked for CKD and T2D, though also present for FH. Some of the patients with pathology tests suggesting a possible diagnosis but no coded diagnosis may have had a known diagnosis that was documented using free text that was not able to be assessed in this study. Patients were flagged as having a possible diagnosis even if there was only a single abnormal pathology test. Without confirmatory testing, our results may provide an overestimate. For example, for CKD to be diagnosed based on pathology testing, abnormalities must be present for 3 months and for T2D pathology tests should be repeated to confirm the abnormality. However, national CKD and T2D prevalence data also rely on pathology tests from one point in time.28 Despite low levels of diagnostic testing for CKD and T2D, this baseline data showed slightly higher numbers with possible or diagnosed CKD and T2D than national data. In the case of FH, some of the patients identified as having a possible diagnosis may have had secondary causes of hyperlipidaemia (eg, nephrotic syndrome or hypothyroidism) rather than FH, which are also important to identify (but were not in scope for this study).
As described above, this study shows the potential for the data extraction tool to identify possible undiagnosed disease in GP. Some have argued that increased testing and expanded disease definitions may result in over-diagnosis, particularly in the case of CKD,29 however, the available evidence suggests that targeted testing of patients with risk factors minimises over-identification and maximises the potential benefit of early identification particularly in relation to CVD prevention.30
Disease prevalence was generally similar or somewhat higher in the baseline data when compared with national estimates from the general population2 28 31–33 and there was substantial disease overlap. However, the prevalence of PVD in the baseline data was much lower than in the limited available data from Australia, which is based on a markedly different population, a study of older males in Western Australia.34 There is currently a paucity of Australian data on PVD prevalence in the general population, although there are data to suggest underdiagnosis.35 Higher disease prevalence was expected in the study population compared with the wider Australian population, as it was for risk factor prevalence, due to frequency of GP attendance and socioeconomic disadvantage, given that socioeconomic disadvantage is associated with higher burden of interrelated chronic vascular disease.36 Where study prevalence was higher than national prevalence, the EMR data captured a great number of those patients with disease, implying greater data reliability for these variables.
Management
Translation of national guidelines and recommendations for chronic diseases was found to be incomplete in our data set. Low levels of coded eye examinations and foot examinations in patients with T2D may reflect unintuitive requirements for coding these data within the EMRs, rather than the examinations not having been performed. The existence of multiple conflicting guidelines impede guideline adherence, for example, different recommendations for statin prescription from Kidney Health Australia(8) compared with the National Vascular Disease Prevention Alliance.37 Other potential guideline related barriers include lack of guideline accessibility, excess complexity and poor clarity38 which may be able to be addressed for future guidelines.
The pharmacotherapy data for HF are limited by the data extraction tool considering all types of HF together and not distinguishing between coded diagnoses of HF with preserved ejection fraction and HF with reduced ejection fraction. It is estimated that around 50% of patients with HF in Australia have HF with preserved ejection fraction39 for which ACE inhibitors/angiotensin receptor blockers and beta blockers are not specifically indicated.
More generally, when assessing medication use, we were unable to assess if patients had contraindications to recommended treatments. We were also not able to assess if patients were receiving prescriptions elsewhere (eg, other GPs, specialist clinics or hospitals) or medications that are available without prescription (eg, aspirin). We included all prescriptions that were currently listed for patients (regardless prescription expiry date) in recognition that patients might have prescriptions from external practitioners.
EMR data issues
Previous research has identified potential concerns with EMR data. These include the multiple different EMR software packages used and a lack of nationally agreed on standards for EMRs resulting in inconsistencies in structure.40 Consistent with our findings, other researchers have identified issues relating to the use of clinical terminology/classification systems and data labelling/definitions as well as issues with accuracy and completeness of data.40 This highlights the limitations of using coded diagnoses from GP EMR data to identify patients with disease. Although more difficult to analyse free text than data extracted from predefined options selected from dropdown menus, analysis of free text using natural language processing may offer rich data.
Strengths and limitations
A major strength of this study is its having been conducted in a ‘real world’ setting rather than a rigorously controlled clinical trial setting, offering a glimpse into everyday practice in participating clinics. This study included quite a large number of patients and represented practices from both city and regional areas. Another strength was the input from practices regarding any concerns with their data and the opportunity this provided for any issues to be interrogated and addressed. An example of this was practices noting lower than expected levels of testing for certain pathology tests; pathology companies were then contacted and missing pathology codes identified and added to the data extraction tool, thereby capturing previously missed tests. This study has provided insights into the challenges of using EMR data, but it has also shown their potential.
Study limitations include the risk that selection bias may have affected the results given that the practices that were approached to participate were not selected at random but based on participation in a prior study or recommendations. Half the practices had participated in a prior study targeting quality improvement in CKD and likely had higher levels of detection and management of CKD, since the earlier study found improvements in these parameters.15 Practices approached based on recommendations may have had an above average interest in quality improvement projects, and participating practices even more so, which may have led to differences in EMR usage if modified in previous quality improvement activities. There was also large variability between practices, as demonstrated by the wide credible intervals. These factors may have affected the representativeness of the data. Between-practice variability was expected a priori as there are many potential differences including practice specific factors (eg, staffing, different EMR software) and practice patient population specific (eg, patient age, sex, socioeconomic position). The risk of bias increases with greater variability between practices, however, this risk exists independent of the analysis method. There were only eight practices in this study, limiting the ability to assess practice correlation between variables and the impact of practice-specific and patient population-specific factors on practice outcomes, however this could be considered in future studies with greater numbers of practices. The absolute cardiovascular risk score, which was used in algorithms determining the required frequency of blood pressure and lipid testing, showed an unexpected distribution of scores, with an unusually high number of patients scoring exactly 16%. This could potentially be explained if in some cases a score of exactly 16% were recorded for people in the high-risk category (ie, score >15%) rather than their actual score. If this were the case, risk categories would not have been compromised, and therefore, our data would not have been affected.
Conclusions
The interrelated chronic vascular diseases CKD, T2D and CVD are a growing public health concern with many in our population already affected by or at risk of one or more of these diseases. Our data showed substantial numbers of patients without risk factor assessment, disease testing, coded diagnoses and disease management as per recommendations for some of these assessed conditions, using data that was able to be extracted from the EMRs. The reasons behind these results are likely to be multifactorial including challenges associated with the extraction and analysis of EMR data, conflicting guidelines that do not account for multimorbidity and that are not appropriate for all patients, the primary use of the EMR being for facilitation of clinical care rather than research, design of the EMR impacting on data entry, lack of patient registration with GPs for chronic disease management and broader issues including health literacy and systematised chronic disease management processes in individual practices. Work to improve the ease of use of guidelines by clinicians may help to improve the translation of recommendations into practice. Modifications to EMRs to make entering coded data more intuitive and other systems changes such as pathology laboratories being required to use unified codes for tests may offer the potential to facilitate improvements in areas with existing deficiencies in quality improvement projects. Despite the limitations of data extracted from GP EMRs, this baseline study shows it has great potential to identify not only patients with the interrelated chronic vascular diseases but also those at risk of these conditions and to identify areas where translation of evidence-based recommendations into practice is incomplete.
Data availability statement
Data are available on reasonable request. The datasets generated and analysed during this study are not publicly available due to stipulations within the ethics approval, but are available from the corresponding author on reasonable request subject to ethics approval.
Ethics statements
Patient consent for publication
Ethics approval
Ethics approval was obtained from the Western Health Research and Ethics Committee, HREC/16/WH/124. Participants gave informed consent to participate in the study before taking part.
Acknowledgments
We would like to thank all participating practices, the North Western Melbourne and Murray Primary Health Networks, Professor David Story and Dr Michael Seman for their assistance with this project.
References
Supplementary materials
Supplementary Data
This web only file has been produced by the BMJ Publishing Group from an electronic file supplied by the author(s) and has not been edited for content.
Footnotes
Twitter @combatstrokeSL
Contributors Conceived the study: CLN. Designed the study: CLN, EDJ, PSH, J-AM-N, CJAN, TW and MPdC. Nephrology input, particularly regarding algorithm development: CLN and JLJ. Lipid specialist input, particularly regarding algorithm development: EDJ. Endocrinology input, particularly regarding algorithm development: PSH. General practice input, particularly regarding algorithm development: J-AM-N. Cardiology input, particularly regarding algorithm development: CJAN, NC. Neurology input, particularly regarding algorithm development: TW. Public health input: MPdC. Statistics lead: KS. Project management: NGL. Data cleaning, analysis and interpretation: KS, JLJ. Drafted the manuscript: JLJ, AT. Guarantor: JLJ. All authors read and approved the final manuscript.
Funding This project received funding from Macedon Ranges and North West Melbourne Medicare Local and from Better Care Victoria; there was no award/grant number.
Disclaimer These funding bodies did not have a role in study design, data collection or analysis, decision to publish or preparation of the manuscript. There was no commercial funding of this project.
Competing interests J-AM-N is an investigator in the Data for Decisions research initiative www.gp.unimelb.edu.au/datafordecisions which uses the GRHANITE research data collection tool. She is a lead investigator on the Future Health Today program which includes a quality improvement platform which differs to the one used in this study. All other authors have declared no conflicts of interest.
Provenance and peer review Not commissioned; externally peer reviewed.
Supplemental material This content has been supplied by the author(s). It has not been vetted by BMJ Publishing Group Limited (BMJ) and may not have been peer-reviewed. Any opinions or recommendations discussed are solely those of the author(s) and are not endorsed by BMJ. BMJ disclaims all liability and responsibility arising from any reliance placed on the content. Where the content includes any translated material, BMJ does not warrant the accuracy and reliability of the translations (including but not limited to local regulations, clinical guidelines, terminology, drug names and drug dosages), and is not responsible for any error and/or omissions arising from translation and adaptation or otherwise.