Article Text

Abstract
Using adherence to diabetes management guidelines as a case study, this paper applied a novel geospatial hot-spot and cold-spot methodology to identify priority counties to target interventions. Data for this study were obtained from the Dartmouth Atlas of Healthcare, the United States Census Bureau’s American Community Survey and the University of Wisconsin County Health Rankings. A geospatial approach was used to identify four tiers of priority counties for diabetes preventive and management services: diabetes management cold-spots, clusters of counties with low rates of adherence to diabetes preventive and management services (Tier D); Medicare spending hot-spots, clusters of counties with high rates of spending and were diabetes management cold-spots (Tier C); preventable hospitalisation hot-spots, clusters of counties with high rates of spending and are diabetes management cold-spots (Tier B); and counties that were located in a diabetes management cold-spot cluster, preventable hospitalisation hot-spot cluster and Medicare spending hot-spot cluster (Tier A). The four tiers of priority counties were geographically concentrated in Texas and Oklahoma, the Southeast and central Appalachia. Of these tiers, there were 62 Tier A counties. Rates of preventable hospitalisations and Medicare spending were higher in Tier A counties compared with national averages. These same counties had much lower rates of adherence to diabetes preventive and management services. The novel geospatial mapping approach used in this study may allow practitioners and policy makers to target interventions in areas that have the highest need. Further refinement of this approach is necessary before making policy recommendations.
- health services research
- health policy research
- healthcare disparities
- diabetes mellitus
This is an open access article distributed in accordance with the Creative Commons Attribution Non Commercial (CC BY-NC 4.0) license, which permits others to distribute, remix, adapt, build upon this work non-commercially, and license their derivative works on different terms, provided the original work is properly cited, appropriate credit is given, any changes made indicated, and the use is non-commercial. See: http://creativecommons.org/licenses/by-nc/4.0/.
Statistics from Altmetric.com
Introduction
Diabetes prevalence in USA has been stable over the past 20 years and has shown declining incidence over the past 8 years.1 Despite the stable prevalence and decreasing incidence of diabetes, more than 25% of Medicare beneficiaries have been diagnosed with diabetes.2 Complications from uncontrolled diabetes are a major source of increased Medicare costs.3 Reducing complications from diabetes by increasing access to diabetes preventive and management services such as haemoglobin A1C tests, blood lipids Low-density lipoprotein cholesterol (LDL-C) tests and eye exams can help reduce preventable hospitalisations and lower associated costs.4–6 However, many individuals at-risk for diabetes or diagnosed with diabetes do not receive preventive or management services.4
Research has demonstrated wide variation in healthcare utilisation, costs and outcomes based on where someone lives.7 Several studies have focused on geographic variation related to diabetes, including the following: diabetes prevalence,8 outcomes of poor diabetic control,9 risk factors,10 racial disparities11 and care management.12 However, these studies are often conducted at a very broad geographic level such as the state or hospital referral region (HRR). Given the substantial geographic variation in factors affecting diabetes care across continental USA, a more focused approach to exploring differences across geographic space may help address the gaps in preventive and management services.
Numerous studies have focused on geographic variation in diabetes-related issues.9 11–14 Specifically, Sargen et al and Margolis et al explored spatial patterns for lower extremity amputation (LEA) for diabetic Medicare enrollees at the HRR level and found geographic clusters of HRRs with high rates of LEAs (hot-spots) in Mississippi, Arkansas, Texas and Oklahoma, while also finding higher spending and mortality in these areas.9 12 Further, A1C testing rates were found to be lower in western Mississippi along the Arkansas and Louisiana border,11 and higher rates of diabetic related LEAs in less affluent and rural areas were found in California.14 Using electronic medical records (EMR) data to explore small-area geographic variation in A1C outcomes in Minnesota, Gabert et al found clusters of areas with poor diabetes control.13
While prior studies have focused independently on geographic clusters of poor diabetes outcomes such as LEAs (hot-spots) and geographic clusters of poor adherence to diabetes management (cold-spots), to our knowledge no study has been conducted to link hot-spot and cold-spot geographic spatial analysis to identify priority areas. The literature has consistently show a strong correlation of poor diabetes preventive and management services and poor health outcomes.3 5 6 By linking hot-spots of higher spending and hospitalisations with cold-spots of diabetes management, we can more precisely identify priority areas for further study and intervention, which may result in improved health outcomes.
Furthermore, the literature to date has mostly used spatial analysis to show variation at the HRR level or focussed on specific areas (eg, counties within states). Our analysis focused on counties for the continental USA. Importantly, once identified as a hot-spot or cold-spot, given the smaller area of geography, counties are easier to investigate for demographic, public health services, provider and practice characteristic variation. Further, counties often align with administrative and political jurisdictions delivering healthcare services.
Objective
The objective of this study was to illustrate the application of a novel geospatial mapping approach to identify priority areas for targeting preventive services and management resources in specific administrative and political jurisdictions. We chose to examine diabetes in particular due the high nationwide prevalence of the disease and costs associated with treating it. The four major study aims included the identification of: (1) diabetes management cold-spots, defined as clusters of counties with low rates of adherence to diabetes management (Tier D); (2) Medicare spending hot-spots, defined as clusters of counties with high rates of spending and that are diabetes management cold-spots (Tier C); (3) preventable hospitalisation hot-spots, defined as clusters of counties with high rates of spending and that are diabetes management cold-spots (Tier B); and (4) counties that are located in a diabetes management cold-spot cluster, preventable hospitalisation hot-spot cluster and Medicare spending hot-spot cluster (Tier A—priority counties).
Methods
Data was obtained at the county level from the Dartmouth Atlas of Healthcare, which includes fee-for service (FFS) beneficiaries between the ages of 65 and 75 with a diagnosis of diabetes in 2014.15 Our three measures of interest were: (1) diabetes management; (2) preventable hospitalisations; and (3) Medicare spending.
We created a diabetes management composite measure (DMPrevCare) using the percentage of FFS beneficiaries aged 65–75 with an annual haemoglobin A1c test, annual blood lipids LDL-C test and annual eye exam. Other measures obtained from the Dartmouth Atlas of Healthcare included discharges for ambulatory care sensitive conditions per 1000 Medicare enrollees (preventable hospitalisations) and price–age–sex–race-adjusted Medicare spending per beneficiary.15 We also included county-level measures from various sources: diabetes prevalence and per cent African–American for the Medicare population from the Centres for Medicare and Medicaid,2 per cent high school graduates (as highest level of education), per cent poverty and unemployment rates from the American Community Survey,16 and per cent rural from University of Wisconsin County Health Rankings.17
Statistical analysis
ArcMap V.10.3 was used for geospatial data management and final map creation,18 while geospatial analysis was conducted with Geoda V.1.12.19 Counties in Alaska and Hawaii were removed from the analysis, along with counties with missing data. The first step for identifying priority counties was to map the three measures of interest by quintile to visually explore the geographic variation. Next, for each of the three measures (DMPrevCare, preventable hospitalisations, Medicare spending) statistically significant hot-spots and cold-spots were identified using the Local Moran’s I statistic,20 which is the most commonly used local indicator of spatial autocorrelation to measure the strength of the relationship of a geography (eg, county) with its neighbours for a particular indicator. The Local Moran’s I statistic is used to detect two types of clusters: hot-spots, which are clusters of high values (eg, Medicare spending) surrounded by high values, and cold-spots, which are clusters of low values (eg, DMPrevCare) surrounded by low values. Statistical significance is determined by comparing the observed values for each geographic unit to randomly assigned values for a set number of permutations. In this study, we ran 99 999 permutations and set the significance value to p=0.05 for the three measures of interest. Spatial relationships were defined using queen contiguity, which defines county neighbours as any county in which it shared a border.20 Statistically significant hot-spots and cold-spots were the core of clusters, meaning that surrounding counties also have similar rates, but may not be actual hot-spots or cold-spots. This justified targeting the core of clusters for additional diabetes preventive and management services as it may have broader impact.
Priority county criteria
The Local Moran’s I analysis was done on each of the three measures, and the results were pooled together to determine the priority areas. Figure 1 displays the four tiers, where Tier D is the lowest priority and Tier A is the highest priority. Tier D counties were identified as DMPrevCare cold-spots (clusters of counties with low rates of diabetic testing). Tier C counties were those counties that were DMPrevCare cold-spots and Medicare spending hot-spots (clusters of counties with high rates of spending). Tier B counties were those counties that were DMPrevCare cold-spots and preventable hospitalisation hot-spots (clusters of counties with high rates of preventable hospitalisations). Finally, our Tier A priority counties were identified as DMPrevCare cold-spots and Medicare spending hot-spots and preventable hospitalisation hot-spots (see figure 1).
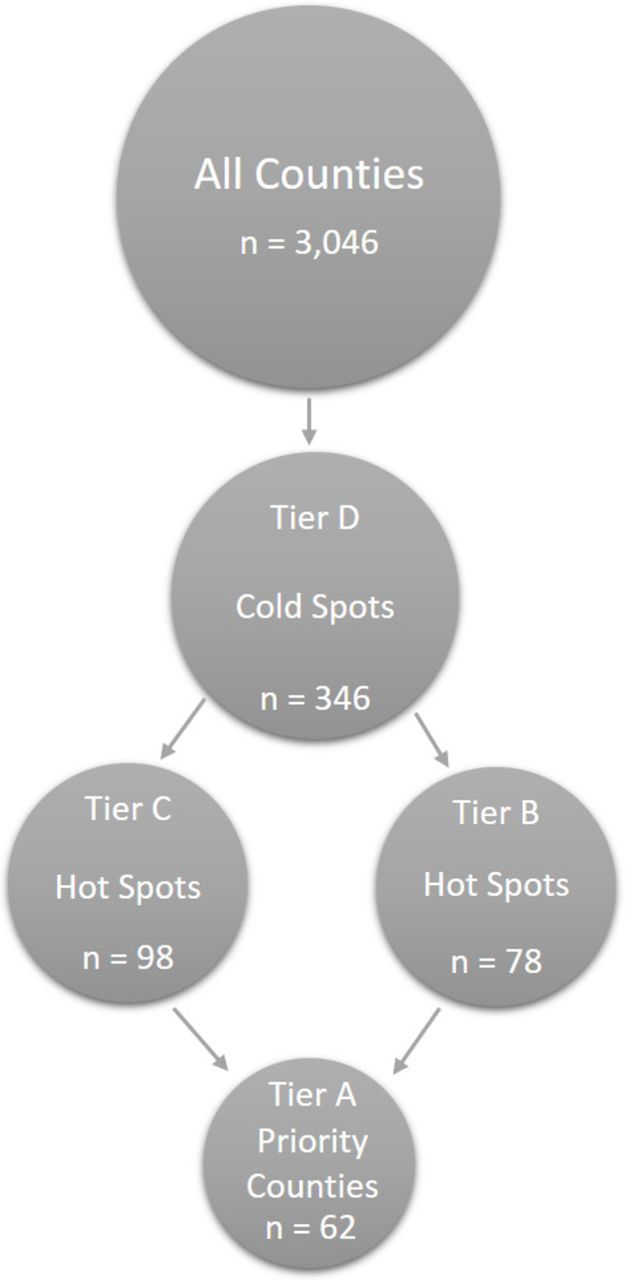
Priority county tiers. The figure displays the four tiers of priority areas, where Tier D is the lowest priority and Tier A is the highest priority. Tier D counties are identified as DMPrevCare cold-spots (clusters of counties with low rates). Tier C counties are those that are DMPrevCare cold-spots and Medicare spending hot-spots (clusters of counties with high rates of spending). Tier B counties are those counties that are DMPrevCare cold-spots and preventable hospitalisation hot-spots (clusters of counties with high rates of preventable hospitalisations). Finally, our Tier A highest priority counties were identified as DMPrevCare cold-spots and Medicare spending hot-spots and preventable hospitalisation hot-spots.
Results
Tiers of priority counties
Appropriate diabetes management cold-spots (Tier D)
Mapping DMPrevCare by quintile showed clear geographic variation. Counties located in the western half of USA, particularly in the mountain states from Montana to Arizona, have lower rates of adherence to DMPrevCare. Counties in Oklahoma, various parts of the southeast and central Appalachia have lower rates, while the upper Midwest and the east coast (with the exception of parts of South Carolina and Georgia) have higher rates of DMPrevCare.
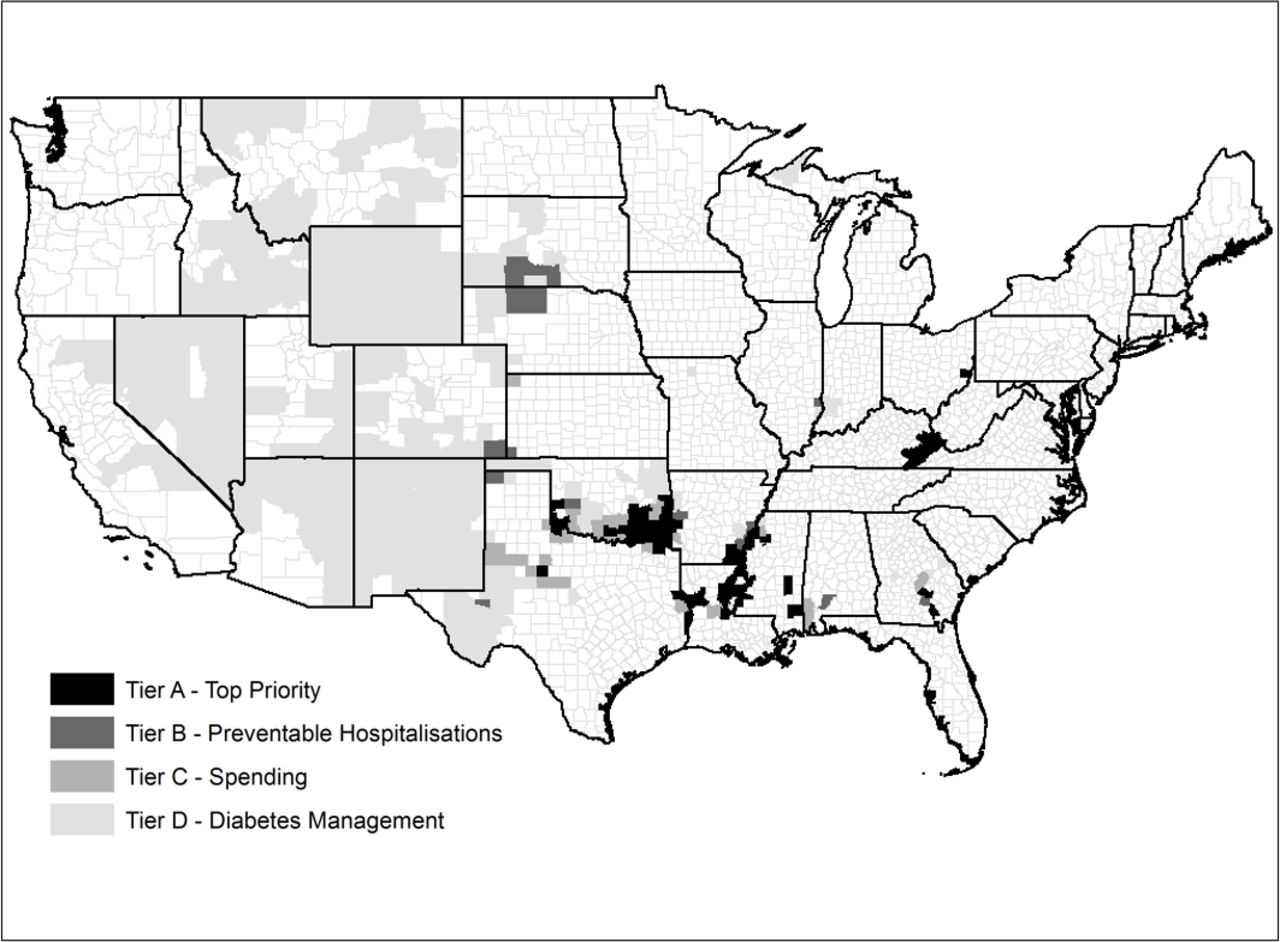
The Local Moran’s I analysis identified 346 counties as cold-spots. These 346 counties, Tier D, make up almost the entire states of Wyoming, New Mexico and Nevada, and large portions of Arizona, Utah, Colorado, Idaho and Montana. Clusters of DMPrevCare cold-spots can also be found in large parts of Oklahoma, Texas, and Louisiana, in the southeast and central Appalachia (see figure 2).
Priority county tiers map. The figure displays the location of priority counties by tier. The darkest counties are the highest priority counties (Tier A), which are defined as being preventable hospitalisation and Medicare spending hot-spots and DMPrevCare cold-spots. Tier B counties are the next darkest colour and are defined as being preventable hospitalisation hot-spots, while Tier C counties are slightly lighter and are defined as being Medicare spending hot-spots. The lightest coloured counties are DMPrevCare cold-spots (Tier D).
Medicare spending hot-spots and diabetes management cold-spots (tier C)
Mapping Medicare spending by county showed significant geographic variation in spending across USA. Higher spending counties were located throughout the southeast, Oklahoma, Texas, Kansas and Appalachia. Counties located in the western half of USA. (with a few exceptions), the Upper Midwest and New England tend to have lower spending.
Next, we identified 98 counties which were diabetes management cold-spots (Tier D) and Medicare spending hot-spots. The 98 Tier C counties are displayed in figure 2 and are located in southern Oklahoma, the Mississippi river valley (Louisiana, Arkansas, Mississippi), along southern Alabama-Mississippi border, parts of south-central Georgia, west Texas and central Appalachia.
Preventable hospitalisation hot-spots and diabetes management cold-spots (Tier B)
While the patterns were not as clear when compared with Medicare spending and DMPrevCare, central Appalachia and parts of the southeast have higher rates of preventable hospitalisations. Focussing on DMPrevCare cold-spots (Tier D) and preventable hospitalisation hot-spots, we identified 78 Tier B counties. Tier B counties were located in similar areas as Tier C counties, with the majority in southern Oklahoma, the Mississippi river valley, southern Mississippi and Alabama, south-central Georgia and central Appalachia.
Preventable hospitalisation, spending hot-spots and diabetes management cold-spots (Tier A)
Finally, we identified 62 priority counties (Tier A) that were part of spending and preventable hospitalisation hot-spots and diabetes management colds spots (see figure 2). Tier A priority counties are located primarily within and around Louisiana, Mississippi, northern Texas and Oklahoma and the central Appalachia region (darkest colour in figure 2). Tier A priority counties were found in nine states, including Oklahoma (n=15), Kentucky (n=12), Louisiana (n=11), Mississippi (n=10), Texas (n=5), Arkansas (n=4), Georgia (n=3), Ohio (n=1) and West Virginia (n=1).
Characteristics of priority counties
The Medicare population in Tier A counties was much larger than the national average, with Tier A counties containing an average of 115.7 Medicare beneficiaries per 1000 residents compared with the national average of 82.0 Medicare beneficiaries per 1000 residents. Table 1 displays demographic and socio-economic characteristics of the priority counties relative to national averages. In general, Tier A priority county populations were more likely to be African–American, stopped school at high school, living in rural areas and living in poverty compared with the nation. With the exception of education level and African–American population, these findings held true for all tiers of counties. Similar to the national comparison, a comparison of Tier A priority counties to Tier D counties revealed that Tier A were more likely to have higher percentages of under-resourced populations.
Demographic and socio-economic characteristics of priority regions relative to US average (US average=1)
Table 2 shows that spending, utilisation and diabetes prevalence were higher and rates of diabetes management were lower in priority counties than the national average for all tiers of counties. Medicare spending was 1.22 times higher (US$ 2000) more per beneficiary for Tier A priority counties. The rate of preventable hospitalisations was more than two times higher in Tier A and Tier B counties relative to the national average. DMPrevCare was on average 8% lower in Tier A counties, while the per cent of Medicare population with diabetes is almost 14 points higher than the national average. The Tier A priority counties had higher preventable hospitalisations, Medicare spending and prevalence of diabetes compared with Tier D counties. Tier A priority counties had a 2% higher DMPrevCare score.
Healthcare utilisation and costs characteristics of priority regions relative to US average (US average=1)
Discussion
This study illustrated the use of a novel geospatial mapping approach to identify priority counties for additional diabetes preventive and management services. We identified four tiers of priority counties with Tier A priority counties considered a top priority for the improvement of diabetes preventive and management services. Several of these counties located in broad areas that have previously been identified as needing improved diabetes preventive and management services.9 10 However, our novel approach provided a more granular geographic identification schema aligned with administrative and political boundaries combined with more targeted approach for intervention than found in prior literature.
A substantial literature has identified modifiable factors related to healthcare delivery as being most important for improved adherence to diabetes management guidelines, including provider and practice level factors.21 22 Recent work by He described characteristics such as EMRs and on-site laboratories that increased the provision of diabetes management services, while also describing provider characteristics, such as productivity compensation payment models, that limited diabetes management.22 Variation in county level practice and provider level characteristics are important modifiable factors that need to be addressed when considering how to improve diabetes preventive and management services. This study highlighted the need for targeted interventions aimed to improve diabetic outcomes based on the barriers and facilitators that are located within each of the discrete geographic areas of the priority counties. Further, through the stratification of the priority counties, we identified a small subset to top priority counties (Tier A) in which substantial improvements in population health may be realised. Real-world interventions, targeted at modifiable providers and practice structure, may be particularly successful when linked to spatial analysis to identify priority counties for intervention.
The methodological approach outlined in this paper was intended to be the first phase of a mixed-methods approach to improving access to diabetes management. Next steps would include rigorous qualitative investigation of provider, practice, health system and county-level features in the priority counties, as well as, quantitative analysis of demographic and socio-economic variables. Through intensive multi-level investigation and analysis of patients and their behaviours, providers and medical practice characteristics and county-level management and policy nuances, each Priority County can be described in detail. By identifying and understanding providers, practices and patients in these priority counties, successful interventions to improve care could be designed.
Furthermore, future steps could investigate bright spot counties of high-performers as comparisons to priority counties. Using the aforementioned method, bright spot, high-performing counties can be identified, and then priority counties can be case matched to similar bright spot counties based on similarities in demographic variables, medical neighbourhood characteristics, size and/or location. By evaluating how and why bright spot counties provide high quality care compared with a matched priority county, interventions can be tailored more precisely to improve diabetes preventive and management services.
The methodology described and applied in this study is not restricted to diabetes at the national level. Instead, it provides a blueprint for conducting similar analyses for any health topic at any geographic level based on data availability.
Strengths and limitations
Strengths of our geospatial mapping approach include the novel use of hot and cold-spots simultaneously to identify the most compelling Priority Counties to focus on for qualitative investigation and intervention for diabetes preventive and management services. Within our study design, we were limited by our dataset, only pulling from publicly available Medicare data, and our measures limited to diabetes only. However, future iterations of this approach could link data from Medicaid and other payers, incorporate sub-county areas, application of novel technologies for disease management, and additional composite measures beyond diabetes could be created and mapped.
Conclusion
Counties with the lowest rates of diabetes management tended to have higher Medicare spending, higher rates of preventable hospitalisations and higher prevalence of diabetes. The exception was in the western areas of USA, which may have accessibility issues due to the very rural nature of the region. Priority counties were generally more rural, had higher rates of poverty, and higher percentages of African–American populations. The identification of priority counties may justify targeted interventions to address the known gap in diabetes preventive and management services. Finally, the geospatial mapping method may offer a potential model for healthcare practitioners concerned with primary care.
Acknowledgments
The authors would like to thank Dr Douglas Kamerow and Dr Stephen Petterson for helping to conceptualise the diabetes preventive care measure (DMPrev) and Mrs Kristin Dale for her helpful editorial comments in the preparation of the manuscript.
References
Footnotes
Contributors MT conceived of the study, performed the analysis and interpreted the results. PJM interpreted the results and prepared the first draft of the manuscript. KS and AMK-E conceived of the study, interpreted the results. All authors reviewed and contributed to the final manuscript.
Funding The authors have not declared a specific grant for this research from any funding agency in the public, commercial or not-for-profit sectors.
Competing interests None declared.
Patient consent for publication Not required.
Ethics approval All data obtained was de-identified, publicly available data, and the research did not need institutional review board approval.
Provenance and peer review Not commissioned; externally peer reviewed.