Article Text

Abstract
Objective In the present study, we sought to explore the relationship between socioeconomic status and prescribing magnitude and cost in primary care throughout Northern Ireland.
Design We performed a retrospective data analysis of general practitioner (GP) prescribing using open-source databases with data collected from May to October 2019 to determine the number of prescriptions and cost of drugs and drug classes by area, ranking these by deprivation index. We used Kendall’s tau to quantify the relationship between prescribing and deprivation.
Setting We analysed open-source data collected from 325 GP practices in Northern Ireland during the period from May to October 2019.
Participants We analysed a total of 2 764 303 prescriptions signed during our study period.
Results Our study indicates a clear trend of increased overall spending per patient (r=−0.1232, p=0.02) and number of prescriptions per patient (r=−0.3440, p<0.001) in areas of higher deprivation. The mean cost per item was higher in less deprived areas (r=0.3809, p<0.001). Overall, £13.79 more was spent and 3.5 more items were prescribed per patient in the most compared with the least deprived decile, although more expensive items tended to be prescribed in areas with lower socioeconomic deprivation (£11.27 per item vs £9.20 per item). We found a statistically significant correlation of prescribing of key drug classes, such as bronchodilators, antidepressants and drugs used to treat diabetes, among others, with greater deprivation. Prescribing of vaccines and drugs used in the treatment of glaucoma was correlated with lower deprivation.
Conclusion We provide an exploration of the correlation of prescribing with deprivation by analysing all prescriptions signed within a 6-month period in Northern Ireland. Our study broadly agrees with published literature, although a few notable exceptions are highlighted. We provide evidence of discrepancies in medication cost between areas of differing deprivation and suggest possible explanations for these trends. This information will be valuable for future investigation of disease prevalence, as well as targeting of patient education and future funding.
- chronic disease
- community medicine
- health equity
- social determinants of health
- general practice
This is an open access article distributed in accordance with the Creative Commons Attribution Non Commercial (CC BY-NC 4.0) license, which permits others to distribute, remix, adapt, build upon this work non-commercially, and license their derivative works on different terms, provided the original work is properly cited, appropriate credit is given, any changes made indicated, and the use is non-commercial. See: http://creativecommons.org/licenses/by-nc/4.0/.
Statistics from Altmetric.com
Key points
We sought to investigate the influence of socioeconomic deprivation on magnitude and cost of prescribing of various therapeutic agents by general practitioners throughout Northern Ireland.
Overall, we found multiple drug classes which correlate with greater or lesser socioeconomic deprivation. Overall, £13.79 more was spent per patient and 3.5 more items per patient were prescribed over our 6-month period in the most deprived decile compared with the least deprived. However, we also found that more expensive items tended to be prescribed in areas with lower socioeconomic deprivation (£11.27 per item vs £9.20 per item).
These results not only indicate the known increased burden of disease among patients with lower socioeconomic status but also may represent unconscious bias among prescribers.
Introduction
In 2010, the Marmot review outlined the startling reality that those living in greater deprivation are more likely to die prematurely.1 Total life expectancy is reduced by 7 years for those living in the most income deprived areas compared with the least deprived areas, and an average of 17 more years are spent living with disability before death. This carries a significant economic burden in terms of increased NHS spending and more time lost from employment. The Scottish Burden of Disease Study2 similarly reported that poorer areas in Scotland had twice the rate of illness or early death than richer areas and are also associated with poorer mental health, as well as higher rates of alcohol misuse, recreational drug use and tobacco use. It is not the case, however, that deprivation is associated with increased prevalence of all diseases equally. Interestingly, sensory organ disease, neck pain, lower back pain and migraine were more common causes of morbidity in wealthier areas. Heart disease and depression were prominent features in both groups. However, the relationship between socioeconomic deprivation and health is complex; although some lifestyle choices, such as smoking, become more common as deprivation increases, even non-lifestyle-related illnesses may themselves result in social stigma or loss of employment and subsequent social migration.
Previous work has focused on the diagnoses of individuals within various socioeconomic groups. We present a nationwide analysis of differential rates of prescribing between areas of differing socioeconomic deprivation using a database of prescriptions signed nationally by general practitioners (GPs) in Northern Ireland. This approach has the distinct advantage of allowing us to quantify clinically significant illnesses which are difficult to characterise by other means, such as depression or symptomatic hypothyroidism. Furthermore, we present analysis of differences in cost of prescribing between areas of high and low deprivations. Our approach has importance not only for further characterising distribution of disease and identification of diseases not previously known to be associated with deprivation, but also for revealing unconscious social biases among prescribers, which may result in differences in care across the deprivation spectrum.
Methods
We made use of three databases hosted by Open Data NI,3 all of which are maintained under the UK Open Government Licence for public sector information4: the April 2019 GP Practice List Sizes dataset5; the 2017 Northern Ireland Multiple Deprivation Measures (NIMDM) dataset (grouped by 2014 wards and 2011 small areas (SAs))6; and the GP Prescribing Data datasets from May 2019 to October 2019 inclusive.7 Postcodes were associated with wards and SAs using the Office for National Statistics Postcode Directory.8 The 2017 NIMDM provides a measure of deprivation at the SA level and uses the seven ‘domains’ of deprivation with their associated weightings (income deprivation, 25%; employment deprivation, 25%; health deprivation and disability, 15%; education, skills and training, 15%; access to services, 10%; living environment, 5%; and crime and disorder, 5%) to provide an overall deprivation rank. Individual areas can then be ranked according to deprivation, although it should be noted that the ranking does not quantify the magnitude of differences in deprivation between areas.9 There are four measures of multiple deprivation used in the UK, one for each country. The measures are unfortunately not directly comparable, as they use data from different time periods, different units of geographical area, and different deprivation domains and weights.
Databases were combined by tagging each prescription with the postcode of the prescribing GP practice, and then the associated ward and deprivation data. Two GP practices closed during our 6-month analysis period and so were excluded. Among the 325 included GP practices, there were 238 unique postcodes. Twenty-three postcodes contained two GP practices; 10 contained three; 2 contained four; 4 contained five; 1 contained six; 2 contained seven; and 1 contained eight. These unique postcodes thus mapped to 174 wards of the total of 462 in Northern Ireland. We combined prescriptions from practices which shared a ward to list total prescriptions per ward, and using the NIMDM dataset ranked wards from most to least deprived. Despite some practices sharing wards, wards were used as they were felt to capture the deprivation index most representative of the population living within a reasonable commute from the practice.
Prescriptions were grouped by British National Formulary (BNF) chapter and section. Our primary analysis was of BNF sections, which group the drugs by most common indication. BNF sections were used as this was felt to provide the most favourable balance between a convenient clinical grouping of drugs by class and a reduction in the number of analysis and, therefore, risk of type I error. We prespecified 12 BNF sections of interest based on importance in terms of high burden of prescribing in general practice, as well as the public health importance of the conditions they aim to treat. Our prespecified sections of interest are listed in table 1. We calculated the number of prescriptions of all drugs and drug classes per 1000 practice-registered patients (PRP) within the outlined 6-month period for each ward. Prescriptions for pancreatin, sterile leg bags and non-sterile leg bags were excluded from our analysis due to non-standardised data entry. Prescriptions for dressings, appliances, incontinence appliances and stoma appliances were also excluded as their indications for prescription are difficult to associate with a particular illness. Kendall’s tau was used to assess the correlation between the number of prescriptions per 1000 PRPs of a drug or drug class and the associated deprivation rank. Kendall’s tau is calculated by dividing the difference between the number of concordant and discordant pairs by the sum of concordant and discordant pairs. This statistical measure was chosen due to the ordinal nature of our data.10 We took a p value of <0.0005 to indicate statistical significance, calculated by application of the Bonferroni correction to the traditional α value of 0.05, corrected for 107 tests performed. Further exploratory analyses on sections of interest were carried out by analysing individual drugs within those classes. Cost was calculated using the gross cost per item provided in the prescribing database, which was taken directly from the BNF. Data analysis was performed in R Studio V.1.2.5033,11 and plots were generated using Gnuplot V.5.2 patchlevel 7.12
Prespecified drug classes and corresponding BNF chapter and section.
Results
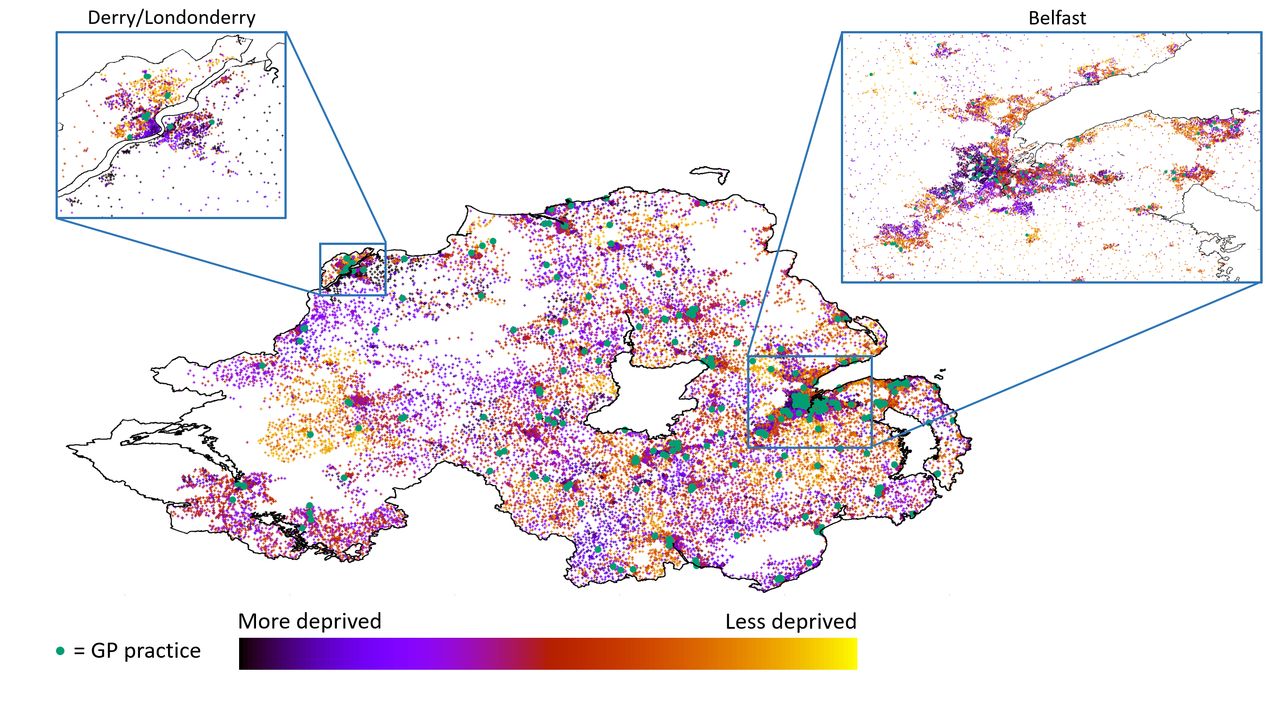
Qualitative analysis of a choropleth map of SAs colour coded by deprivation rank revealed clear clustering of areas with similar rank (figure 1). Areas of deprivation surrounding GP practices were sufficiently homogeneous as to permit our assumption that practices tend to serve patients of a similar deprivation rank. Median deprivation rank among wards containing GP practices was 179.5 (IQR 84.3–292.3), compared with 264.5 (IQR 149.5–360.3) for those wards without practices. Indeed wards containing GP practices were skewed towards greater socioeconomic deprivation (skew=0.38, kurtosis=1.98, p=0.003),13 as has been observed in a previous study.14

Choropleth map of Northern Ireland with each postcode plotted as a coloured point on the MAP, and associated multiple deprivation index (based on small areas) as dot colour (see key). Locations of GP practices are highlighted with a green dot. Zoomed views of Northern Ireland's two cities (Derry/Londonderry and Belfast) are also shown. GP, general practitioner.
We analysed a total of 2 764 303 prescriptions using Kendall’s tau to calculate the correlation with deprivation for each BNF section and individual prescription item. Since areas are ranked from most deprived to least deprived, those areas with a lower deprivation rank have a higher overall deprivation score, and thus a negative correlation coefficient indicates a greater degree of prescribing in areas with higher socioeconomic deprivation. Correlation coefficients for all BNF sections analysed are shown in online supplementary table 1, with selected results presented graphically in figure 2. Greater deprivation was correlated with higher rates of prescribing for the majority (82.2%) of BNF sections. Prescription of 8 of our 12 prespecified drug classes correlated significantly with higher deprivation according to our corrected p value (online supplementary table 1), with 11 of 12 reaching the traditional level of statistical significance. Correlation coefficients relating to a selection of individual drugs of interest are presented in figure 3.
Supplemental material
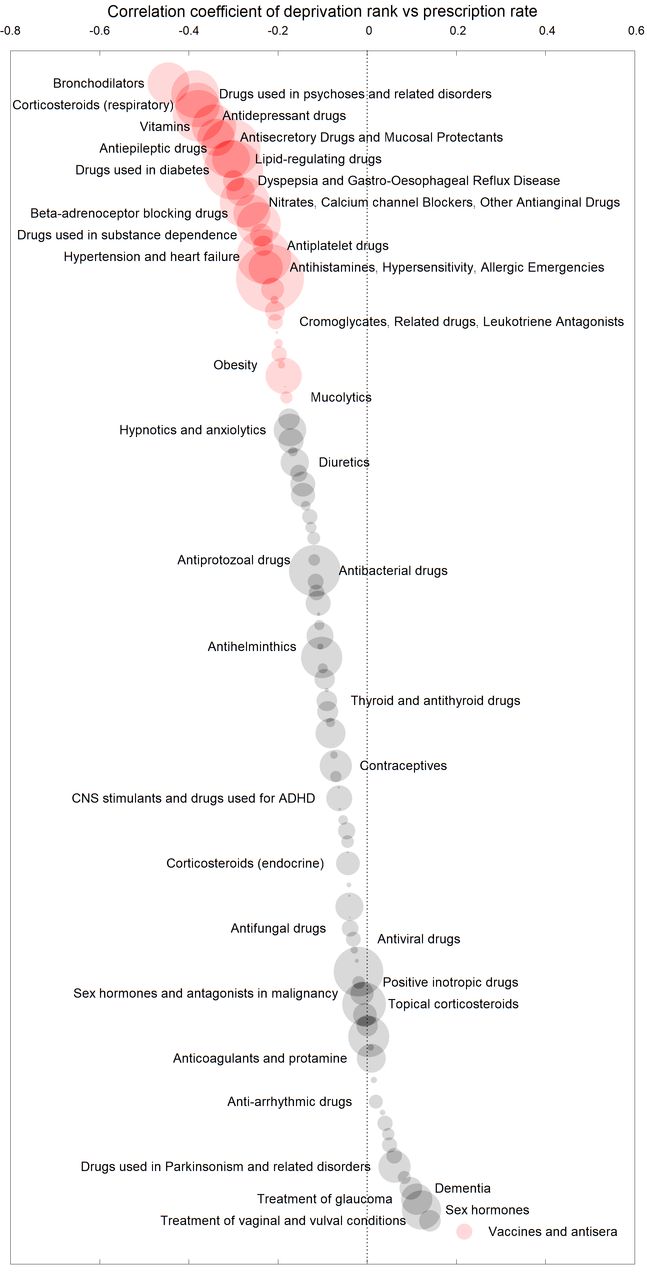
Bubble plot to show the Kendall’s tau correlation coefficient of prescription rate of drug classes (grouped by British National Formulary section) with multiple deprivation index. More negative correlation coefficient indicates a greater degree of prescribing in areas with greater socioeconomic deprivation. Bubble area indicates the number of prescriptions of this class. Drug classes which differed significantly from zero (corrected p<0.0005) are highlighted in red. Key drug classes are labelled. ADHD, attention-deficit hyperactivity disorder; CNS, central nervous system.
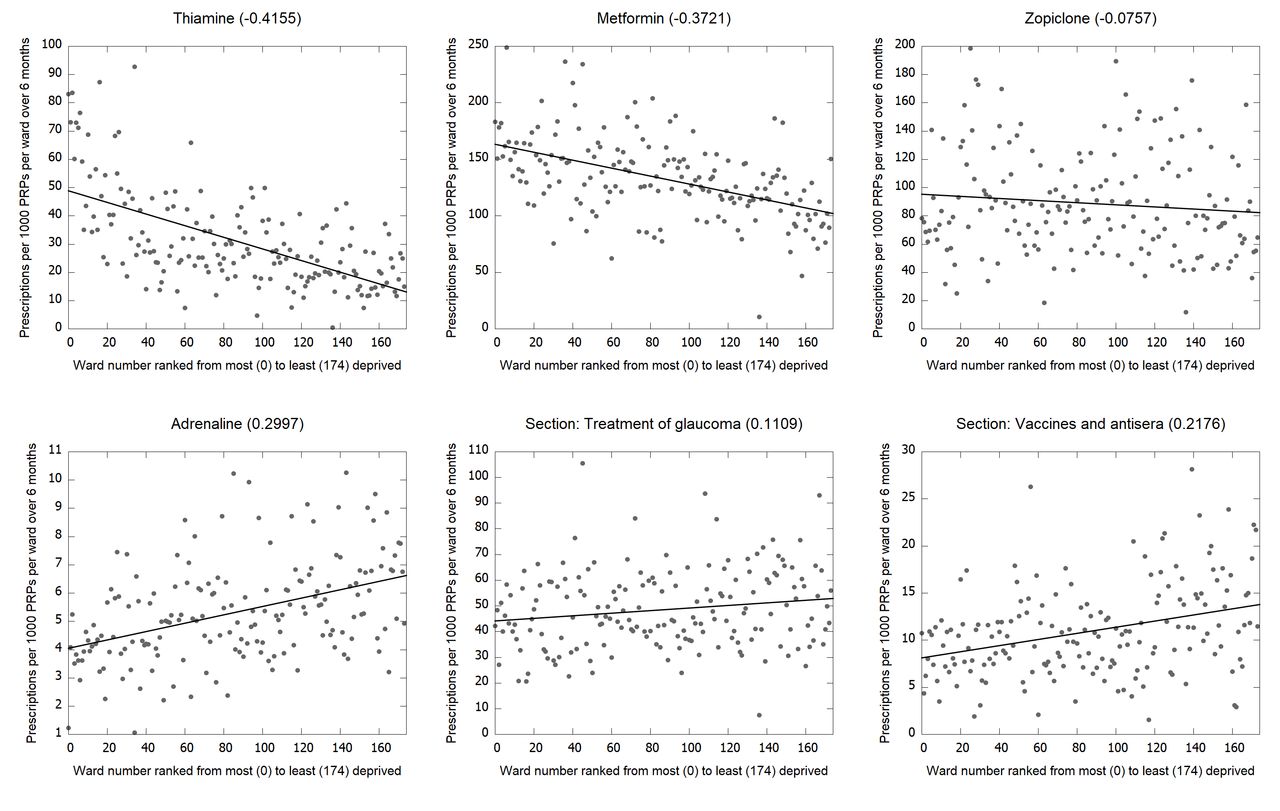
Trends of prescriptions per 1000 PRPs per 6 months plotted against deprivation rank, where each point represents a ward with pooled GP practices as described. Data are presented for selected individual drugs and British National Formulary sections of interest. Kendall’s tau correlation coefficient is presented in brackets next to the title. GP, general practitioner; PRP, practice-registered patient.
In the following paragraphs, r represents the Kendall’s tau correlation coefficient; n represents the number of prescriptions; D1 and D10 represent the mean prescriptions per 1000 patients per 6 months in the 1st decile (most deprived) and 10th decile (least deprived), respectively. Figure 4 presents our cost analysis across deprivation rank. Deprivation correlates weakly with greater overall cost per patient (r=−0.1232, p=0.016). However, when examining the mean prescription cost and the items per patient individually, it is clear that there are two competing trends. Higher mean medication cost correlates with reduced socioeconomic deprivation (r=0.3809, p<0.001). This trend is balanced by the correlation of number of items prescribed per patient with increasing deprivation (r=−0.3440, p<0.001). Overall, £13.79 more was spent per PRP over our 6-month period in the most compared with the least deprived decile (£112.96 vs £99.17), with 3.5 more items prescribed in the most deprived decile (12.4 vs 8.8). We also found that more expensive items tended to be prescribed in areas with lower socioeconomic deprivation (£11.27 per item vs £9.20 per item). When individual BNF sections were analysed, 62.1% of sections exhibited increasing drug cost in association with more positive individual drug correlation coefficients, suggesting that more expensive drugs were favoured in areas with lower deprivation even for similar indications.

Line graphs to demonstrate the association between items prescribed and costs of the items. The top graph demonstrates the cost per PRP over 6 months against deprivation, showing that cost per PRP increases with increasing deprivation. The middle graph demonstrates that the average item cost per PRP increases with decreasing deprivation. The bottom graph demonstrates that the number of items per PRP increases with increasing deprivation. The correlation coefficient calculated by Kendall’s tau is depicted on the bottom right of each graph. PRP, practice-registered patient.
The University Healthcare Centre at Queen’s was a consistent outlier in terms of lower prescribing cost per patient (figure 4) and was found to have dramatically reduced prescribing of the majority of BNF sections and individual medications when compared with practices of similar deprivation rank. This is likely due to the very different population served by the University Healthcare Centre, including mostly students who are likely to be younger and have fewer comorbidities.
Discussion
Summary
We analysed open-source databases of all prescriptions signed by GP practices in Northern Ireland from May to October 2019 in order to calculate how prescription frequency and cost correlates with deprivation. We have uncovered two competing trends, resulting in cost per PRP correlating weakly with increased deprivation: a smaller amount of more expensive medications are prescribed in areas of lower deprivation. Possible explanations include an unconscious prescriber bias towards newer and more expensive medications in affluent areas, a more educated population likely to conduct independent research and specifically request newer medications, or possibly more affluent patients representing to their practice with an intolerance of side effects as an alternative to reduced compliance.15 Indeed, there is some preceding evidence of unconscious prescriber bias among GPs in the UK, with a tendency for more expensive medication to be prescribed in practices with an attached dispensary.16 Another argument sees treatments for issues faced in more deprived areas as more common, better researched or with a larger cohort of off-label drugs, thus reducing cost. Further study into the causes of these associations is needed.
Strengths and limitations
Due to the large number of prescriptions analysed, we were able to observe several statistically significantly correlations with deprivation. This analysis across a varied national landscape of deprivation, between both urban and rural populations, lends itself well to eliciting overall patterns of prescribing. However, we do acknowledge the possibility of type I error due to the large number of analyses performed and attempted to mitigate this by prespecifying BNF sections of interest as outlined earlier.
Our model assumes that patients in each area visited their closest GP practice, and that GPs serve a homogeneously deprived community. In reality, patients are likely to commute a short distance to a familiar practice, and in fact, 24% of small output areas in Northern Ireland are known to be over 1.5 km from a GP practice.14 However, this is likely to decrease the magnitude of correlation rather than appreciably skew results. We found a tendency for practices to be present in areas with greater socioeconomic deprivation, although controlled for any effect on our results by using relative deprivation rank of wards containing practices. This is, however, a potential source of bias; since analysis was conducted based on GP practice deprivation rank rather than that of the individual patient, individuals living in areas of low socioeconomic deprivation may not have had their ward deprivation rank captured in the analysis. We also assume that populations of wards are large enough so as to consider the demographics of the wards to be comparable, although the databases we used unfortunately do not provide this information to enable direct comparison. Thus, given that we analysed geographical areas, it is possible that our results suffer from the ecological fallacy; thus, further work would ideally include individual patient demographic data and the association of this with prescribing burden and deprivation, rather than aggregated data per GP practice. A further key assumption is that the prescriptions we analysed represent the entire burden of national prescribing. It is, of course, likely that hospital and private prescriptions make up a significant minority of prescriptions, although repeat prescriptions for long-term chronic health conditions are often supplied by the patients’ local GP practice. It should also be noted that the deprivation index simply provides a rank of deprivation between areas and does not quantify the difference in deprivation between them.
Comparison with existing literature
Drugs correlated with increasing deprivation
Bronchodilators, used in the treatment of chronic obstructive pulmonary disease (COPD) and asthma, diseases closely linked with cigarette smoking, exhibited the strongest correlation with deprivation (r=−0.4459, p<0.001, n=58 190, D1=457.4, D10=207.2), with salbutamol, tiotropium and theophylline demonstrating particularly strong trends. Respiratory corticosteroids were the third most correlated with deprivation (r=−0.3806, p<0.001, n=65 868, D1=269.9, D10=164.1); mucolytics exhibited a similar trend. Cromoglycates, leukotriene receptor antagonists and phosphodiesterase type 4 inhibitors are also associated with increasing deprivation, suggesting that the aforementioned trends also reflect the known increased prevalence of asthma with higher deprivation and are not due to smoking-related COPD alone.17 18
Drugs used in the treatment of mental health disorders also correlated with increased deprivation, including antipsychotics (r=−0.3858, p<0.001, n=76 420, D1=204.2, D10=101.7), antidepressants (r=−0.3785, p<0.001, n=88 480, D1=1153.6, D10=659.9), hypnotics and anxiolytics (r=−0.1733, p<0.001, n=35 272, D1=413.6, D10=296.2), and drugs used in substance dependence (r=−0.2373, p<0.001, n=17 101, D1=20.3, D10=28.8), reflecting the known correlation of increasing deprivation with poor mental health19 and recreational drug and alcohol abuse, although the decile means in this case do not reflect the overall correlation. The unexpected correlation of prescription of vitamins with deprivation is dominated by thiamine (r=−0.4155, p<0.001, n=3025, D1=60.8, D10=20.7), a vitamin used specifically in those with alcohol dependence, further indicating the prevalence of this condition in more deprived areas (figure 3). Antiepileptic drugs are correlated with increasing deprivation (r=−0.3056, p<0.001, n=1 16 490, D1=317.2, D10=205.2), reflecting a previously observed but not yet fully understood trend.20 Confounding this pattern is the fact that drugs in this class often have dual indications, with gabapentin (r=−0.3299, p<0.001, n=8863, D1=77.7, D10=34.3) also indicated for neuropathic pain and anxiety disorders, lamotrigine (r=−0.3264, p<0.001, n=16 034, D1=40.4, D10=24.0) also used as an adjunct in bipolar disorder among others and carbamazepine (r=−0.2327, p<0.001, n=13 301, D1=25.2, D10=14.7) indicated for trigeminal neuralgia and diabetic neuropathy. However, even drugs indicated solely for seizure control, such as levetiracetam (r=−0.2934, p<0.001, n=11 943, D1=23.1, D10=13.2), perampanel (r=−0.1633, p=0.002, n=1015, D1=1.43, D10=0) and Phenytoin sodium (r=−0.1523, p=0.003, n=3426,D1=4.8, D10=0.7) exhibited correlation with increasing deprivation.
Drugs used in the treatment of diabetes also correlate with deprivation (r=−0.3004, p<0.001, n=1 18 520, D1=456.8, D10=307.2), reflecting the literature.21 Indeed metformin, one of the first-line treatments for type 2 diabetes, is the fourth most correlated with deprivation of all drugs analysed (figure 3). Lipid-regulating drugs (r=−0.3054, p<0.001, n=47 641, D1=657.5, D10=457.6), drugs for treating hypertension and heart failure (r=−0.2318, p<0.001, n=99 284, D1=541.4, D10=411.8), and beta-adrenoceptor blockers (r=−0.2587, p<0.001, n=45 728, D1=423.0, D10=315.4) also feature, as do diuretics, nitrates, calcium channel blockers, antianginal drugs, antiplatelet agents and drugs used in the treatment of obesity. This reflects high prevalence of the metabolic syndrome22 and obesity23 24 in areas with increased deprivation. Drugs used in the treatment of gastro-oesophageal reflux disease (including proton pump inhibitors and antacids) correlate with increasing deprivation, along with urea [13-C], which is used in the diagnosis of Helicobacter pylori infection.
Antibacterial drugs were found to correlate with increased deprivation (r=−0.1177, p=0.021, n=8 86 666, D1=347.7, D10=290.6), as has been noted previously in an analysis of national prescribing data in Scotland.25
Drugs with no correlation with deprivation
Prescription contraceptives did not correlate with deprivation index (r=−0.0705, p=0.167, n=34 506, D1=90.3, D10=81.7), although unintended pregnancy has previously been associated with low socioeconomic status.26 27 This is in contrast to a study analysing contraceptive habits of women in the UK in the 1990s, which reported that women with a higher social class and level of education were more likely to use contraception.28 It is likely that contraceptive practice has changed in the 30-year interval since that study, conceivably due to increasing education.29 However, these results are difficult to interpret in the context of the Northern Irish population, as heavy segregation of areas based on religious affiliation is likely to confound trends of contraception usage.
Zopiclone and zolpidem did not correlate with deprivation, despite their use in insomnia and high potential for addiction, in contrast to a previous study investigating the use of sedative medications by deprivation index in England.30 Although drugs used in the treatment of attention-deficit hyperactivity disorder (ADHD) were not found to significantly correlate with deprivation when analysed as a cohort, some of the individual medications did correlate. Thus, we cannot state that we support the published association of ADHD with deprivation.31
A host of medications used in the treatment of diseases not typically related to lifestyle were found to have no correlation with deprivation index, including treatments for hypothyroidism and hyperthyroidism, drugs for Parkinsonism and related disorders, drugs used in the treatment of dementia, anticoagulants, digoxin and antiarrhythmics.
Drugs correlated with lower deprivation
Only a small number of drug classes correlated with lower socioeconomic deprivation. Prescribing of vaccines and antisera correlated with lower deprivation (r=0.2176, p<0.001, n=8557, D1=8.5, D10=13.1). Two broad classes of vaccines are prescribed by GP practices: childhood immunisations and travel vaccines. The correlation was particularly clear for the typhoid vaccine, used almost exclusively before foreign travel. This trend may be attributed to a combination of a greater likelihood for foreign travel in the more affluent population and possibly a greater awareness of the need for vaccination among this group. Uptake of vaccines in general has been previously shown to correlate with lower socioeconomic deprivation.32 Suggested explanations include a possible increased uptake of novel child health technologies in more educated and affluent areas, although conversely, these areas may in fact suffer from a greater susceptibility to vaccine scares.33 It should be noted, however, that GP practices do not represent the entire burden of prescribing of vaccinations, as immunisations can also be administered through schools and employers.
Glaucoma, which is often asymptomatic in the early phase, is primarily detected on screening. That the treatment for glaucoma is correlated with lower deprivation (r=0.1406, p=0.006, n=15 470, D1=42.7, D10=51.8) may suggest a greater engagement with eye check-ups and health screening in general in this group. Indeed, a study in London has described an association between glaucoma and greater socioeconomic deprivation,34 although a systematic review and meta-analysis of studies comparing access to eye services concluded that more work is required in this area to fully identify and explain any access discrepancies.35
Sex hormones, specifically estradiol (r=0.1795, p<0.001, n=21 033, D1=23.5, D10=36.7), a drug used in hormone replacement therapy, correlated with decreasing deprivation. Lawlor et al have previously reported this association in a retrospective analysis of over 4000 women, although it is unclear as to whether this represented a true effect or was influenced by confounders.36 Further work in this area, ideally including well-controlled prospective studies, is required to further explore this relationship.
Drugs related to allergy correlated with higher deprivation (r=−0.2278, p<0.001, n=38 871, D1=224.9, D10=155.5), but of interest is that epinephrine, the only emergency drug within this section, in fact correlated well with lower deprivation (r=0.2997, p<0.001, n=4650, D1=3.9, D10=6.5) (figure 3), which is consistent with emerging evidence of a higher prevalence of allergy among those with lower socioeconomic deprivation.37 However, the result may be confounded by a greater awareness of the serious effects of anaphylaxis and the need to carry emergency injectors in more educated patients. These results may indicate a need for further targeting of more deprived populations for assessment and education regarding the use of these life-saving medications.
Association of cost and number of prescriptions with deprivation
Our observation that the number of prescriptions and overall cost of prescribing is associated with increased socioeconomic deprivation in Northern Ireland is in agreement with a previous retrospective study within the country, which found comparable numbers and cost of prescriptions over their study period among the subset of 55 GP practices analysed.38
Conclusion
The dichotomy between drugs used in the treatment of diseases predominantly associated with lifestyle factors, which correlate with high deprivation, and those used as treatments for the non-lifestyle-associated diseases, which generally do not correlate with deprivation, is impossible to ignore. Thus, the differing average prescription cost observed between different areas may represent development of newer and thus more expensive drugs for those diseases which are represented more equally across all areas, possibly due to increased investment or charitable donation. Our results provide a paradigm for further analysis and thought regarding differences in treatment between patients of differing socioeconomic class; we reveal discrepancies in cost of prescribing between areas of greater and lesser socioeconomic deprivation, highlighting a need for increased targeting of more deprived populations for education regarding not only healthy lifestyle choice but also contact with health professionals for appropriate assessment and screening.
References
Footnotes
Contributors JSF and GRF conceived of the study design, analysed the data, drafted the manuscript and figures, and provided critical revision. JSF additionally provided details of clinical correlation of results for the discussion.
Funding The authors have not declared a specific grant for this research from any funding agency in the public, commercial or not-for-profit sectors.
Competing interests None declared.
Patient consent for publication Not required.
Ethics approval There are no specific ethical declarations for this work, as non-identifiable, retrospective, open-source data were used.
Provenance and peer review Not commissioned; externally peer reviewed.
Data availability statement Data are available upon reasonable request. Data regarding correlation coefficients for each drug can be made available upon reasonable request from the corresponding author.