Article Text

Abstract
Clinical prediction models are used frequently in clinical practice to identify patients who are at risk of developing an adverse outcome so that preventive measures can be initiated. A prediction model can be developed in a number of ways; however, an appropriate variable selection strategy needs to be followed in all cases. Our purpose is to introduce readers to the concept of variable selection in prediction modelling, including the importance of variable selection and variable reduction strategies. We will discuss the various variable selection techniques that can be applied during prediction model building (backward elimination, forward selection, stepwise selection and all possible subset selection), and the stopping rule/selection criteria in variable selection (p values, Akaike information criterion, Bayesian information criterion and Mallows’ Cp statistic). This paper focuses on the importance of including appropriate variables, following the proper steps, and adopting the proper methods when selecting variables for prediction models.
- epidemiology
This is an open access article distributed in accordance with the Creative Commons Attribution Non Commercial (CC BY-NC 4.0) license, which permits others to distribute, remix, adapt, build upon this work non-commercially, and license their derivative works on different terms, provided the original work is properly cited, appropriate credit is given, any changes made indicated, and the use is non-commercial. See: http://creativecommons.org/licenses/by-nc/4.0/.
Statistics from Altmetric.com
Introduction
Prediction models play a vital role in establishing the relation between the variables used in the particular model and the outcomes achieved and help forecast the future of a proposed outcome. A prediction model can provide information on the variables that are determining the outcome, their strength of association with the outcome and predict the future of an outcome using their specific values. Prediction models have countless applications in diverse areas, including clinical settings, where a prediction model can help with detecting or screening high-risk subjects for asymptomatic diseases (to help prevent developing diseases with early interventions), predicting a future disease (to help facilitate patient–doctor communication based on more objective information), assisting in medical decision-making (to help both doctors and patients make an informed choice regarding treatment) and assisting healthcare services with planning and quality management.
Different methodologies can be applied to build a prediction model, which techniques can be classified broadly into two categories: mathematical/statistical modelling and computer-based modelling. Regardless of the modelling technique used, one needs to apply appropriate variable selection methods during the model building stage. Selecting appropriate variables for inclusion in a model is often considered the most important and difficult part of model building. In this paper, we will discuss what is meant by variable selection, why variable selection is important, the different methods for variable selection and their advantages and disadvantages. We have also used examples of prediction models to demonstrate how these variable selection methods are applied in model building. The concept of variable selection is heavily statistical and general readers may not be familiar with many of the concepts discussed in this paper. However, we have attempted to present a non-technical discussion of the concept in a plain language that should be accessible to readers with a basic level of statistical understanding. This paper will be helpful for those who wish to be better informed of variable selection in prediction modelling, have more meaningful conversations with biostatisticians/data analysts about their project or select an appropriate method for variable selection in model building with the advanced training information provided by our paper. Our intention is to provide readers with a basic understanding of this extremely important topic to assist them when developing a prediction model.
Basic principles of variable selection in clinical prediction modelling
The concept of variable selection
Variable selection means choosing among many variables which to include in a particular model, that is, to select appropriate variables from a complete list of variables by removing those that are irrelevant or redundant.1 The purpose of such selection is to determine a set of variables that will provide the best fit for the model so that accurate predictions can be made. Variable selection is one of the most difficult aspects of model building. It is often advised that variable selection should be more focused on clinical knowledge and previous literature than statistical selection methods alone.2 Data often contain many additional variables that are not ultimately used in model developing.3 Selection of appropriate variables should be undertaken carefully to avoid including noise variables in the final model.
Importance of variable selection
Due to rapid digitalisation, big data (a term frequently used to describe a collection of data that is extremely large in size, is complex and continues to grow exponentially with time) have emerged in healthcare and become a critical source of the data that has helped conceptualise precision public health and precision medicine approaches. At its simplest level, precision health involves applying appropriate statistical modelling based on available clinical and biological data to predict patient outcomes more accurately. Big data sets contain thousands of variables, which makes it difficult to handle and manage efficiently using traditional approaches. Consequently, variable selection has become the focus of much research in different areas including health. Variable selection offers many benefits such as improving the performance of models in terms of prediction, delivering variables more quickly and cost-effectively by reducing training and utilisation time, facilitating data visualisation and offering an overall better understanding of the underlying process that generated the data.4
There are many reasons why variables should be selected, including practicality issues. It is not practical to use a large set of variables in a model. Information involving a large number of variables may not be available for all patients or may be costly to collect. Some variables also may have a negligible effect on outcome and can therefore be excluded. Having fewer variables in the model means less computational time and complexity.5 According to the principle of parsimony, simple models with fewer variables are preferred over complex models with many variables. Many variables in the model make the model more dependent on the observed data.6 Simple models are easier to interpret, generalise and use in practice.7 However, one needs to ensure that important variables are not excluded from the simple model.
There is no set rule as to the number of variables to include in a prediction model as it often depends on several factors. The ‘one in ten rule’, a rule that stipulates for how many variables/parameters can be estimated from a data set, is quite popular in traditional clinical prediction modelling strategy (eg, logistic regression and survival models). According to this rule, one variable can be considered in a model for every 10 events.8 9 To illustrate, if information for 500 patients is available in a data set and 40 patients die (events) during the study/follow-up period, in predicting mortality, the ‘one in ten rule’ implies that four variables can be considered reliably in the model to give a good fit. Other rules also exist, such as the ‘one in twenty rule’,10 ‘one in fifty rule’11 or ‘five to nine events per variable rule’,12 depending on the research question(s). Peduzzi et al 9 13 suggested 10–15 events per variable for logistics and survival models to produce reasonably stable estimates. While there are many different rules, these rules are only approximations, and there are situations where fewer or more observations than have been suggested are needed.14 If more variables are included in a prediction model than the sample data can support, the issue of overfitting (achieving overly optimistic results that do not really exist in the population and hence fail to replicate the results in another sample) may arise, and prediction outside the training data (the data used to develop the model) will be not useful. Having too many variables (with respect to the number of observation/data set) in a model will result in a relation between variables and the outcome that only exists in that particular data set but not in the true population and power (the probability of detecting an effect when the effect is already there) to detect the true relationships will be reduced.14 Including too many variables in a model may deliver results that appear important but may not be in the true population context.14 There are examples where prediction models developed using too many candidate variables in a small data set perform poorly when applied to an external data set.15 16
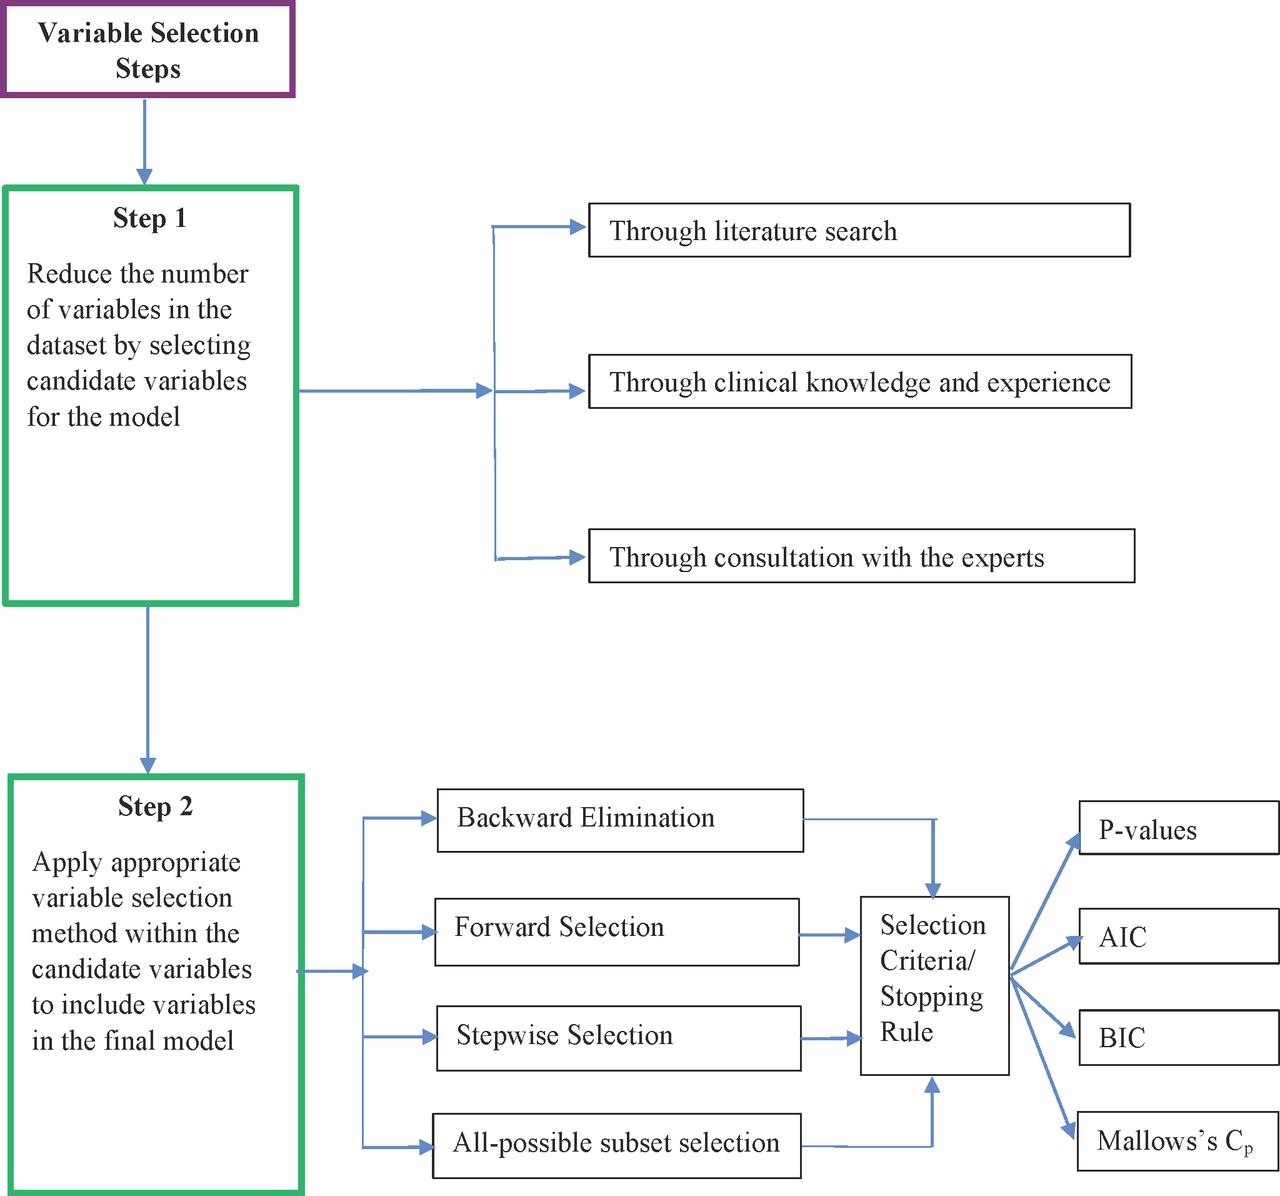
Existing theory and literature, as well as experience and clinical knowledge, provide a general idea as to which candidate variables should be considered for inclusion in a prediction model. Nevertheless, the actual variables used in the final prediction model should be determined by analysing the data. Determining the set of variables for the final model is called variable selection. Variable selection serves two purposes. First, it helps determine all of the variables that are related to the outcome, which makes the model complete and accurate. Second, it helps select a model with few variables by eliminating irrelevant variables that decrease the precision and increase the complexity of the model. Ultimately, variable selection provides a balance between simplicity and fit. Figure 1 describes the steps to follow in variable selection during model building.
Variable selection steps. AIC, Akaike information criterion; BIC, Bayesian information criterion.
Variable reduction strategies
One way to restrict the list of potential variables is to choose the candidate variables first, particularly, if the sample is small. Candidate variables for a specific topic are those that have demonstrated previous prognostic performance with the outcome.17 Candidate variables for a specific topic can be selected based on subject matter knowledge before a study begins. This can be achieved by reviewing the existing literature on the topic and consulting with experts in the area.7 In addition, systematic reviews and meta-analyses can be performed to identify candidate variables. With respect to systematic reviews, counting the number of times a variable was found important/significant in the different studies has been shown to be helpful in identifying candidate variables.7
Grouping/combining similar, related variables based on subject knowledge and statistical technique can also help restrict the number of variables. If variables are strongly correlated, combining them into a single variable has been considered prudent.7 For example, systolic blood pressure and diastolic blood pressure are strongly correlated. In choosing between the two, mean blood pressure may be a better option than selecting either one of them individually.7 However, it has also been argued that variables that are highly correlated should be excluded a priori as they provide little independent information.17 18 Removing a correlated variable should not affect the performance of the model, as it measures the same underlying information as the variable to which it correlates.5 Ultimately, both combining correlated variables and excluding them beforehand help restrict the number of variables.
How variables are distributed can also provide an indication of which ones to restrict. Variables that have a large number of missing values can be excluded, because imputing a large number of missing values will be suspicious to many readers due to the lack of reliable estimation, which problem may recur in applications of the model.7 17 Often, 5–20 candidate variables are sufficient to build an adequate prediction model.7 Nevertheless, care must be taken in restricting variables, as one drawback is that certain variables and their effects may be excluded from the prediction model.
Variable selection methods
Once the number of potential candidate variables has been identified from the list of all available variables in the data set, a further selection of variables is made for inclusion in the final model. There are different ways of selecting variables for a final model. However, there is no consensus on which method is the best.17 There are recommendations that all candidate variables should be included in the model, which approach is called the full model approach.17 A model developed using the full model approach has advantages. In a full model approach, the problem of selection bias is absent and the SEs and p values of the variables are correct.17 However, due to practical reason and the difficulties involved in defining a full model, it often is not possible to consider the full model approach.17
It has also been suggested that variable selection should start with the univariate analysis of each variable.6 Variables that show significance (p<0.25) in the univariate analysis, as well as those that are clinically important, should be included for multivariate analysis.6 Nevertheless, univariate analysis ignores the fact that individual variables that are weakly associated with the outcome can contribute significantly when they are combined.6 This issue can be solved partially by setting a higher significance level to allow more variables to illustrate significance in the univariate analysis.6 In general, when there are many candidate variables available and there is confusion or uncertainty regarding which variables to consider in the final model development, formal variable selection methods should be followed. Outlined below are four major variable selection methods: backward elimination, forward selection, stepwise selection and all possible subset selection, and a discussion of their pros and cons.
Backward elimination
Backward elimination is the simplest of all variable selection methods. This method starts with a full model that considers all of the variables to be included in the model. Variables then are deleted one by one from the full model until all remaining variables are considered to have some significant contribution to the outcome.1 The variable with the smallest test statistic (a measure of the variable’s contribution to the model) less than the cut-off value or with the highest p value greater than the cut-off value—the least significant variable—is deleted first. Then the model is refitted without the deleted variable and the test statistics or p values are recomputed. Again, the variable with the smallest test statistic or with the highest p value greater than the cut-off value is deleted in the refitted model. This process is repeated until every remaining variable is significant at the cut-off value. The cut-off value associated with the p value is sometimes referred to as ‘p-to-remove’ and does not have to be set at 0.05.
Kshirsagar et al 19 developed a hypertension prediction model for middle-aged and older adults using data from two community-based cohorts in the USA. The purpose of the study was to develop a simple prediction model/score with easy and routinely available variables. The model was developed using 7610 participants and eight variables (age, level of systolic and diastolic blood pressure, smoking, family history of hypertension, diabetes mellitus, female sex, high body mass index (BMI), lack of exercise). Candidate variables were selected based on the scientific literature and numeric evidence. One of the data sets did not have information on a specific variable (family history of hypertension) used in the final model. Values for this variable were imputed, however, this approach is not ideal and often not recommended,7 as imputing a large number of missing values can raise questions as to acceptability and accuracy of the outcome. The study applied a backward elimination variable selection technique to select variables for the final model with a conventional p value threshold of 0.05. The study found that some important variables did not contribute independently to the outcome following multivariate adjustment. Setting a higher threshold for the p value and giving priority to clinical reasoning in selecting variables, along with statistical significance, perhaps would have allowed more important variables to be entered into the model.
While a set of variables can have significant predictive ability, a particular subset of them may not. Unfortunately, both forward selection and stepwise selection do not have the capacity to identify less predictive individual variables that may not enter the model to demonstrate their joint behaviour. However, backward elimination has the advantage to assess the joint predictive ability of variables as the process starts with all variables being included in the model. Backward elimination also removes the least important variables early on and leaves only the most important variables in the model. One disadvantage of the backward elimination method is that once a variable is eliminated from the model it is not re-entered again. However, a dropped variable may become significant later in the final model.
Forward selection
The forward selection method of variable selection is the reverse of the backward elimination method. The method starts with no variables in the model then adds variables to the model one by one until any variable not included in the model can add any significant contribution to the outcome of the model.1 At each step, each variable excluded from the model is tested for inclusion in the model. If an excluded variable is added to the model, the test statistic or p value is calculated. The variable with the largest test statistic greater than the cut-off value or the lowest p value less than the cut-off value is selected and added to the model. In other words, the most significant variable is added first. The model then is refitted with this variable and test statistics or p values are recomputed for all remaining variables. Again, the variable with the largest test statistic greater than the cut-off value or the lowest p value less than the cut-off value is chosen from among the remaining variables and added to the model. This process continues until no remaining variable is significant at the cut-off level when added to the model. In forward selection, if a variable is added to the model, it remains there.1
Dang et al 20 developed a predictive model (BariWound) for incisional surgical site infections (SSI) within 30 days of bariatric surgery. The objective was to construct a clinically useful prediction model to stratify individuals into different risk groups (eg, very high, high, medium and low). A clinically rich database, Metabolic and Bariatric Surgery Accreditation and Quality Improvement Program was used to develop the prediction model. An initial univariate screen was performed to identify baseline variables that were significantly associated (p<0.05) with the outcome 30-day SSI. Variables then were checked further for clinical relevance with the outcome. Finally, a forward selection procedure (p<0.01) was applied among the selected variables in the univariate screen to build the prediction model. A total of nine variables (procedure type, chronic steroid or immunosuppressant use, gastro-oesophageal reflux disease, obstructive sleep apnoea, sex, type 2 diabetes, hypertension, operative time and BMI) identified through forward selection were included in the final model. As mentioned earlier, a p value threshold of 0.05 in univariate screening and of 0.01 in forward selection is a concern, as it creates the chance of missing some important variables in the model.
One advantage of forward selection is that it starts with smaller models. Also, this procedure is less susceptible to collinearity (very high intercorrelations or interassociations among independent variables). Like backward elimination, forward selection also has drawbacks. In forward selection, inclusion of a new variable may make an existing variable in the model non-significant; however, the existing variable cannot be deleted from the model. A balance between backward elimination and forward selection is therefore required which can be achieved in stepwise selection.
Stepwise selection
Stepwise selection methods are a widely used variable selection technique, particularly in medical applications. This method is a combination of forward and backward selection procedures that allows moving in both directions, adding and removing variables at different steps. The process can start with both a backward elimination and forward selection approach. For example, if stepwise selection starts with forward selection, variables are added to the model one at a time based on statistical significance. At each step, after a variable is added, the procedure checks all the variables already added to the model to delete any variable that is not significant in the model. The process continues until every variable in the model is significant and every excluded variable is insignificant. Due to its similarity, this approach is sometimes considered as a modified forward selection. However, it differs from forward selection in that variables entered into the model do not necessarily remain in the model. However, if stepwise selection starts with backward elimination, the variables are deleted from the full model based on statistical significance and then added back if they later appear significant. The process is a rotation of choosing the least significant variable to drop from the model and then reconsidering all dropped variables to re-enter into the model. Stepwise selection requires two separate significance levels (cut-offs) for adding and deleting variables from the model. The significance levels for adding variables should be less than the significance levels for deleting variables so that the procedure does not get into an infinite loop. Within stepwise selection, backward elimination is often given preference as in backward elimination the full model is considered, and the effect of all candidate variables is assessed.7
Chien et al 21 developed a new prediction model for hypertension risk in the Chinese population. A prospective cohort of 2506 ethnic Chinese community individuals in Taiwan was used to develop the model. Two different models, a clinical model with five variables and a biochemical model with eight variables, were developed. The objective was to identify high-risk Chinese community individuals with hypertension risk using the newly developed model. The variables for the model were selected using the stepwise selection method, the most common method for variable selection that permits using both forward and backward procedures iteratively in model building. Generally, to apply a stepwise selection procedure, a set of candidate variables need to be identified first. However, information about candidate variables and the number of variables considered in stepwise selection was absent in this study. Although it was indicated that the selected variables were statistically associated with the risk of hypertension, without a discussion about the potential candidate variables, how variables were selected and how many were included in the model, the reader is left uninformed about the variable selection process, which raises concern about the reliability of the finally selected variables. Moreover, setting a higher significance level is strongly recommended in stepwise selection to allow more variables to be included in the model. A significance level of only 0.05 was used in this study, and that cut-off value can sometimes miss important variables in the model. This likely happened in this study, as an important variable termed ‘gender’ was forcefully entered into the biochemical model even though it did not appear significant at the 0.05 level. Alternatively, the study could use Akaike information criterion (AIC) or Bayesian information criterion (BIC) (discussed later), which often provide the most parsimonious model.
The stepwise selection method is perhaps the most widely used method of variable selection. One reason is that it is easy to apply in statistical software.7 This method allows researchers to examine models with different combinations of variables that otherwise may be overlooked.6 The method is also comparatively objective as the same variables are generally selected from the same data set even though different persons are conducting the analysis. This helps reproduce the results and validate in model.7 There are also disadvantages to using the stepwise selection method. There is instability of variable selection if a different sample is used; however, a large effective sample size (50 events per variable) can help overcome this issue.6 The p values obtained by this method are also in doubt, as so many multiple tests occur during the selection process. If there are too many candidate variables, then the method fails to provide the best model, as some irrelevant variables are entered into the model.1 6 The regression coefficients obtained by this method are also biased. It also prevents researchers from thinking about the problem.1 There is also criticism that stepwise and other automated variable selection processes can generate biologically implausible models.6 Collinearity is often considered a serious issue in stepwise variable selection. Variables that best describe a particular data set are chosen by the stepwise procedure due to their high-magnitude coefficients for that data set, not necessarily for the underlying population. If there are two highly correlated variables and they contribute equally to the outcome, there is a good chance that both of the correlated variables will be out of the model in stepwise selection if they are individually less significant than other non-correlated variables. Conversely, if one of the two correlated variables contributes substantially better to the outcome for a particular data set and thus appears in the model, the estimate of its coefficient can be much higher in magnitude than its true population value. Additionally, potential valuable information from its correlated variable can be lost and the results less generalisable.
All possible subset selection
In all possible subset selection, every possible combination of variables is checked to determine the best subset of variables for the prediction model. With this procedure, all one-variable, two-variable, three-variable models, and so on, are built to determine which one is the best according to some specific criteria. If there are K variables, then there are 2K possible models that can be built.
Holden et al 22 developed a model to identify variables (which combination of perceptions) that best predict bar-coded medication administration (BCMA) acceptance (intention to use, satisfaction) using cross-sectional survey data among registered nurses in the Midwest United States. An all possible subset selection procedure was used to identify combinations of variables to model BCMA acceptance most efficiently. Two different models were constructed. In model 1, the outcome of acceptance was nurses’ behavioural intention to use BCMA while in model 2, the outcome of acceptance was nurses’ satisfaction with BCMA. A set of nine theory-based candidate variables (seven perception and two demographic) were assessed for inclusion in the models. To determine the optimal set of variables for the models, investigators assessed every combination of the models generated by an all possible subset selection procedure using five different measures. After comparing the various models according to five different measures, the best model was selected. Application of an all possible subset selection procedure was feasible here due to the small number of candidate variables.
The ability to identify a combination of variables, which is not available in other selection procedures, is an advantage of this method.7 Among the disadvantages, computing can be an issue in an all subset selection procedure, as the number of possible subsets can be huge and many models can be produced, particularly when the number of variables is large. In addition, an all possible subset selection procedure can produce models that are too small23 or overfitted due to examining many models with multiple testing.7 Further, a selection criterion needs to be specified in advance.
Stopping rule/selection criteria in variable selection
In all stepwise selection methods including all subset selection, a stopping rule or selection criteria for inclusion or exclusion of variables need to be set. Generally, a standard significance level for hypothesis testing is used.7 However, other criteria are also frequently used as a stopping rule such as the AIC, BIC or Mallows’ Cp statistic. We discuss these major selection criteria below.
P values
If the stopping rule is based on p values, the traditional choice for significance level is 0.05 or 0.10. However, the optimum value of the significance level to decide which variable to include in the model is suggested to be 1, which exceeds the traditional choices.18 This suggestion assumes absence of few strong variables or completely irrelevant variables in the data.18 In reality, some strong and some irrelevant variables always exist in the outcome. In such a situation, a significance level of 0.50 is proposed, which allows some variables to exit in the selection process.18 There is also a strong recommendation for using a p value in the range of 0.15–0.206, although using a higher significance level has the disadvantages that some unimportant variables may be included in the model.6 However, we believe a higher significance level for variable selection should be considered so that important variables relevant to the outcome are not missed and to avoid deleting less significant variables that may have practical and clinical reasoning.
Akaike information criterion
AIC is a tool for model selection that compares different models. Including different variables in the model provides different models, and AIC attempts to select the model by balancing underfitting (too few variables in the model) and overfitting (too many variables in the model).24 Including too few variables often fails to capture the true relation and too many variables create a generalisability problem.25 A trade-off is therefore required between simplicity and adequacy of model fitting and AIC can help achieve this.26 A model cannot precisely represent the true relation that exists in the data, as there is some information loss in estimating the true relation through modelling. AIC tries to estimate that relative information loss compared with other candidate models. Quality of the model is believed to be better with smaller information loss and it is important to select the model that best minimises that loss. Candidate models for the specific data are ranked from best to worst according to the value of AIC.24 Among the available models for the specific data, the model with minimum AIC is best.26
AIC only provides information about the quality of a model relative to the other models and does not provide information on the absolute quality of the model. With a small sample size (relative to a large number of parameters/variables or any number of variables/parameters), AIC often provides models with too many variables. However, this issue can be solved with a modified version of AIC called AICC, which introduces an extra penalty term for the number of variables/parameters. For a large sample size, this penalty term becomes zero and AICC subsequently converges to AIC, which is why it is suggested that AICC be used in practice.24
Bayesian information criterion
BIC is another variable selection criterion that is similar to AIC, but with a different penalty for the number of variables (parameters) included in the model. Like AIC, BIC also balances between simplicity and goodness of model fitting. In practice, for a given data set, BIC is calculated for each of the candidate models, and the model corresponding to the minimum BIC value is chosen. BIC often chooses models that are more parsimonious than AIC, as BIC penalises bigger models more due to the larger penalty term inherent in its formula.27
Although there are similarities between AIC and BIC, and both criteria balance simplicity and model fit, differences exist between them. The underlying theory behind AIC is that the data stem from a very complex model, there are many candidate models to fit the data and none of the candidate models (including the best model) are the exact functional form of the true model.25 In addition, the number of variables (parameters) in the best model may not include all variables (parameters) in the true model.25 In other words, a best model is only an approximation of the true model and a true model that perfectly represents reality does not exist.24 Conversely, the underlying theory behind BIC is that the data are derived from a simple model and there exists a candidate model that represents the true model.25 Depending on the situation, however, each criterion has an advantage over the other. There are many studies that have compared AIC and BIC and recommended which one to use. If our objective is to select a best model that will provide maximum predictive accuracy, then AIC is superior (because there is no true model, and the best model is selected to maximise the predictive accuracy and represent an approximate true relation). However, if the goal is to select a correct model that is consistent, then BIC is superior (because BIC consistently selects the correct model from among the candidate models that best represent the true model).25 For large data sets, the performance of both criteria improves, but with different objectives.25
Mallows’ Cp statistic
Mallows’ Cp statistic is another criterion used in variable selection. The purpose of the statistic is to select the best model using a subset of variables from all available variables. This criterion is most widely used in the all subset selection method. Different models derived in all subset selection are compared based on Mallows’ Cp statistic and the model with the lowest Mallows’ Cp statistic closest to the number of variables plus the constant is often chosen. A small Mallows’ Cp value near the number of variables indicates that the model is relatively more precise than other models (small variance and less bias).28
Conclusion
It is extremely important to include appropriate variables in prediction modelling, as model’s performance largely depends on which variables are ultimately included in the model. Failure to include the proper variables in the model provides inaccurate results, and the model will fail to capture the true relation that exists in the data between the outcome and the selected variables. There are numerous occasions when prediction models are developed without following the proper steps or adopting the proper method of variable selection. Researchers need to be more aware of and cautious about these very important aspects of prediction modelling.
References
Footnotes
Twitter @drturin
Contributors TCT and MZIC developed the study idea. MZIC prepared the manuscript with critical intellectual inputs from TCT. The manuscript has been finalised by MZIC and TCT.
Funding The authors have not declared a specific grant for this research from any funding agency in the public, commercial or not-for-profit sectors.
Competing interests None declared.
Patient consent for publication Not required.
Provenance and peer review Not commissioned; externally peer reviewed.
Data availability statement There are no data in this work.