Article Text

Abstract
Objective We performed a segmentation analysis of the unvaccinated adult US population to identify sociodemographic and psychographic characteristics of those who were vaccine accepting, vaccine unsure and vaccine averse.
Design Cross-sectional.
Setting Nationally representative, web-based survey.
Participants 211 303 participants aged ≥18 years were asked in the Household Pulse Survey conducted during 1 December 2021 to 7 February 2022, whether they had ever received a COVID-19 vaccine. Those answering ‘No’ were asked their receptivity to the vaccine and their responses were categorised as vaccine averse, unsure and accepting. Adjusted prevalence ratios (APR) were calculated in separate multivariable Poisson regression models to evaluate the correlation of the three vaccine dispositions.
Results Overall, 15.2% of US adults were unvaccinated during 1 December 2021 to 7 February 2022, ranging from 5.8% in District of Columbia to 29.0% in Wyoming. Of the entire unvaccinated population nationwide, 51.0% were vaccine averse, 35.0% vaccine unsure and 14.0% vaccine accepting. The likelihood of vaccine aversion was higher among those self-employed (APR=1.11, 95% CI 1.02 to 1.22) or working in a private company (APR=1.09, 95% CI 1.01 to 1.17) than those unemployed; living in a detached, single-family house than in a multiunit apartment (APR=1.15, 95% CI 1.04 to 1.26); and insured by Veterans Affairs/Tricare than uninsured (APR=1.22, 95% CI 1.01 to 1.47). Reasons for having not yet received a vaccine differed among those vaccine accepting, unsure and averse. The percentage reporting logistical or access-related barriers to getting a vaccine (eg, difficulty getting a vaccine, or perceived cost of the vaccine) was relatively higher than those vaccine accepting. Those vaccine unsure reported the highest prevalence of barriers related to perceived safety/effectiveness, including wanting to ‘wait and see’ if the vaccines were safe (45.2%) and uncertainty whether the vaccines would be effective in protecting them from COVID-19 (29.6%). Those vaccine averse reported the highest prevalence for barriers pertaining to lack of trust in the government or in the vaccines (50.1% and 57.5% respectively), the perception that COVID-19 was not that big of a threat (32.2%) and the perception that they did not need a vaccine (42.3%).
Conclusions The unvaccinated segment of the population is not a monolith, and a substantial segment may still get vaccinated if constraining factors are adequately addressed.
- COVID-19
- health promotion
- vaccination refusal
Data availability statement
Data are available in a public, open access repository. All data analysed are publicly available at https://www.census.gov/programs-surveys/household-pulse-survey/datasets.html.
This is an open access article distributed in accordance with the Creative Commons Attribution Non Commercial (CC BY-NC 4.0) license, which permits others to distribute, remix, adapt, build upon this work non-commercially, and license their derivative works on different terms, provided the original work is properly cited, appropriate credit is given, any changes made indicated, and the use is non-commercial. See: http://creativecommons.org/licenses/by-nc/4.0/.
Statistics from Altmetric.com
WHAT IS ALREADY KNOWN ON THIS TOPIC
COVID-19 vaccines are safe and effective at reducing the risk of COVID-19 infection, serious illness and death. Yet, a substantial segment of the US adult population is yet to be vaccinated 1 year after the first COVID-19 vaccine became available. We described the proportion of unvaccinated American adults who may still be open to getting vaccinated against COVID-19.
WHAT THIS STUDY ADDS
Overall, 15.2% of US adults were unvaccinated during 1 December 2021 to 7 February 2022, as assessed in the Household Pulse Survey (pooled n=211 303). Of the unvaccinated, 51.0% were vaccine averse, 35.0% vaccine unsure and 14.0% vaccine accepting, with differing reasons for having not yet received a vaccine. Those vaccine accepting reported the highest prevalence for logistical or access-related barriers such as difficulty getting a vaccine, or perceived cost. Those vaccine unsure reported the highest prevalence of barriers related to perceived safety/effectiveness. Conversely, those vaccine averse reported the highest prevalence for barriers pertaining to lack of trust in the government or in the vaccines, coupled with low perceived susceptibility to and low perceived seriousness of COVID-19.
HOW THIS STUDY MIGHT AFFECT RESEARCH, PRACTICE OR POLICY
The unvaccinated are not a monolith but vary in their underlying perceived barriers. These data could inform targeted efforts to increase COVID-19 vaccine uptake. The ‘unsure’ and ‘accepting’ are potential targets, with different approaches for each.
Introduction
The year 2022 marks a major turning point in the global fight against the COVID-19 pandemic. Remarkable efforts have been made to overcome logistical constraints in the supply chain,1 and in the USA, COVID-19 vaccine supply has met and exceeded demand.2 3 Yet, non-trivial segments of the population are yet to receive a vaccine dose.4 5 Previous studies at the start of vaccine rollout characterised these individuals,6–8 but it is not clear how these characteristics may have changed over the course of the pandemic.
Targeted efforts to scale vaccine coverage to cover as much of the population as possible will involve targeting those who might be open to receiving a COVID-19 vaccine if their reasons for concern are addressed. Recognising that potential differences in vaccine disposition might exist among the unvaccinated population, it is important to segment this population into those that are vaccine accepting, vaccine unsure and vaccine averse, as each of these subsegments might warrant unique interventions. Urgency for such targeted interventions is warranted as most COVID-19 restrictions have been removed,9 including several international travel restrictions. With a return to on-site work and increased social interaction, there may be a higher risk of exposure to susceptible individuals.10 Looking for ways to specifically target those who were unsure or accepting could inform future vaccination efforts, especially in the light of the possibility of new emerging/re-emerging infectious diseases.
To provide novel insights to inform public health planning, programmes and policy in this rapidly evolving COVID-19 landscape, we performed a segmentation analysis of the unvaccinated population to identify sociodemographic and psychographic characteristics of those who were vaccine accepting, vaccine unsure and vaccine averse. This nuanced approach improves on several past studies that lumped all these three segments as one homogenous bloc of ‘vaccine hesitant’ individuals. As these vaccine-hesitant individuals comprise vaccine-averse individuals,11 a secondary objective of our study was to examine what ideological factors were the strongest drivers of such aversion when comparing subgroups with the highest versus lowest prevalence of vaccine aversion. In other words, how much of the gap in vaccine aversion between the most and least vaccine-averse groups was explained by the differences in various vaccine-related attitudes and perceptions. From an equity perspective, we broke down these differences in vaccine aversion along the lines of several indicators associated with disparity, including indicators of socioeconomic position, race/ethnicity, gender, mental health status and disability.
Methods
Data source
Data were from the Household Pulse Survey conducted between 1 December 2021 and 7 February 2022. The Household Pulse Survey is an ongoing, biweekly survey of the civilian, non-institutionalised US population aged ≥18 years conducted by the US Census Bureau.12 Participants were randomly selected to represent the nation, individual states and selected metropolitan areas. The Household Pulse Survey uses the Census Bureau’s Master Address File as the source of sampled housing units. The sample design was a systematic sample of all eligible housing units, with adjustments applied to the sampling intervals to select a large enough sample to create state-level estimates and estimates for the top 15 metropolitan statistical areas. To field the survey, the US Census Bureau conducts this information collection online using Qualtrics as the data collection platform. All survey initiations for the Household Pulse Survey are distributed to sampled participants via email and short messaging service (SMS), and data collection occurs entirely on the web. The data collection platform is optimised for use on a mobile device, so may be used via any type of internet access. To increase sample size and generate smaller subsample estimates with greater precision, we combined data from three survey cycles conducted during 1 December 2021 to 7 February 2022 (pooled n=211 303). Ethical review was not sought as the secondary data set was deidentified and lacked private information. Likewise, publicly available data set was deidentified and lacked private information.
Measures
Vaccine status and attitudes
To assess vaccination status, the survey asked participants whether they had ever ‘received a COVID-19 vaccine’ (‘Yes’ or ‘No’). Those answering ‘No’ were asked reasons for having not yet received a COVID-19 vaccine. Their receptivity to being vaccinated was assessed with the question: ‘Once a vaccine to prevent COVID-19 available to you would you…’ (1) ‘Definitely get a vaccine’; (2) ‘Probably get a vaccine’; (3) ‘Be unsure about getting a vaccine’; (4) ‘Probably NOT get a vaccine’; (5) ‘Definitely NOT get a vaccine’. We used participants’ responses to categorise them as vaccine averse (a ‘definitely not’ response), vaccine unsure (a ‘probably not’ or an ‘unsure’ response) or vaccine accepting (everyone else).
Disability
Disability/limitation was defined based on self-reported presence of selected impairments, including vision, hearing, cognition and movement. Any disability/limitation was defined as an affirmative response pertaining to at least one of the disabilities/limitations listed.
Mental health status
Participants were asked how often they had symptoms of anxiety, worry, anhedonia (lack of interest) and depression over the last 2 weeks. Potential response options for each question included ‘Not at all’, ‘Several days’, ‘More than half the days’ and ‘Nearly every day’. Each variable was dichotomised such that ‘Not at all’ indicated the absence of the symptom and ‘Several days’, ‘More than half the days’ and ‘Nearly every day’ indicated the presence of the symptom (ie, any days).
Sociodemographic characteristics
These included gender, race/ethnicity, education, age group, household type (ie, multiple, or single adult household with or without children), dwelling (single or multiunit dwelling), employer (government, private, non-profit organisation, self-employed/family business, other) and occupational setting. Since numerous public health interventions and programmes have been delivered at the workplace (eg, employer-assisted housing, smoking cessation counselling, childcare and insurance, among others),13–16 we were interested in exploring how vaccine hesitancy varied by different settings and what opportunities could exist to leverage the workplace to better improve vaccine coverage.
Statistical analyses
Data were weighted to yield representative estimates; all percentages, including prevalence estimates and population distributions, are weighted, whereas raw counts are unweighted. The percentage of unvaccinated adults was calculated nationally and by state (denominator comprising all US adults aged 18+ years). Among the unvaccinated (ie, denominator comprising US adults aged 18+ years who reported they had never received a COVID-19 vaccine), reasons for not yet being vaccinated were compared by vaccine disposition (ie, vaccine averse, unsure and accepting).
Adjusted prevalence ratios (APR) were calculated in three multivariable Poisson regression models to evaluate binary indicators of COVID-19 vaccine aversion, unsureness and acceptance as functions of key explanatory variables and control covariates. Our null hypothesis was that these indicators had no association with key explanatory variables. Among the reasons cited as barriers to vaccination, we used Blinder-Oaxaca decomposition analysis17 to determine which reasons were the strongest drivers of vaccine aversion. Specifically, we measured how much of the gap in vaccine aversion between the most averse and the least averse sociodemographic groups (for indicators with at least 10 percentage points difference in vaccine aversion between the most and least averse) was explained by each of the stated reasons for non-vaccination individually and in groups of related reasons (perceived vaccine safety/effectiveness, social capital as measured by trust in government and in the vaccine, access to COVID-19 vaccines and perceived susceptibility towards COVID-19). A two-sided alpha of 0.05 was used to determine statistical significance. All statistical analyses were performed using Stata V.15.
Results
The unvaccinated US population and its segments
Overall, 15.2% of US adults were unvaccinated during 1 December 2021 to 7 February 2022, ranging from 5.8% in District of Columbia (DC) to 29.0% in Wyoming (table 1, figure 1). By occupation type, the percentage of unvaccinated was lowest among those working in hospitals (4.0%) but highest among those working in agriculture, forestry, fishing or hunting (33.1%). Of the entire unvaccinated population nationwide, 51.0% were vaccine averse, 35.0% vaccine unsure and 14.0% vaccine accepting. Vaccine aversion among the unvaccinated was highest in Alaska (66.5%), adults with household income of 200 000 per annum, aged 65+ years, non-Hispanic white, insured by Veterans Affairs (VA)/Tricare and with a graduate degree (table 2). By gender, vaccine aversion among the unvaccinated was highest among those identifying as transgender (67.2%) and other gender not otherwise specified (69.5%). Other disparities in vaccination status existed by income, age and number of children in the household, as shown in table 2.
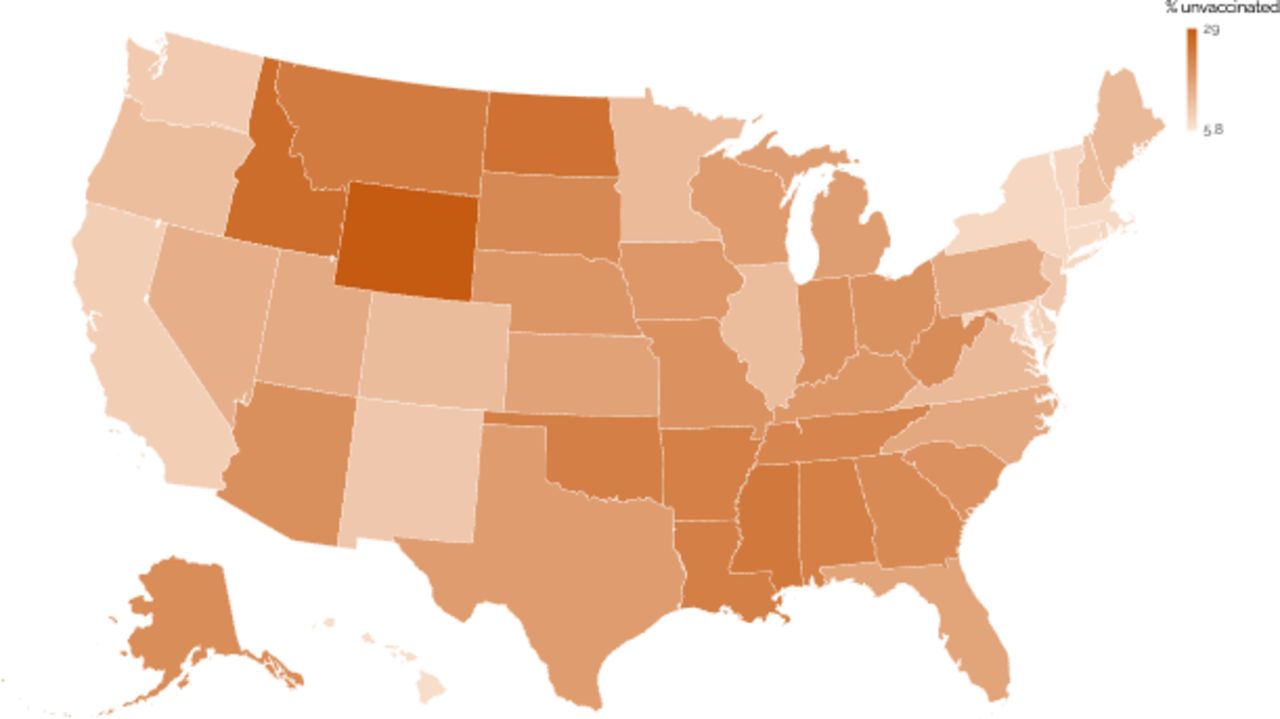
Percentage of US adults who reported they had never received a COVID-19 vaccine, by state. Household Pulse Survey, 1 December 2021 to 7 February 2022.
Vaccine disposition of unvaccinated US adults by state, Household Pulse Survey, 1 December 2021 to 7 February 2022
Sociodemographic characteristics of unvaccinated US adults by vaccine disposition, Household Pulse Survey, 1 December 2021 to 7 February 2022
Among the unvaccinated, occupational differences existed in vaccine disposition. For example, unvaccinated deathcare workers (eg, mortuary home workers) were the least ambivalent regarding whether they would accept a COVID-19 vaccine (ie, vaccine unsure). Specifically, only 7.2% of unvaccinated deathcare workers reported being vaccine unsure, whereas 67% were vaccine averse and 25.7% were vaccine accepting. In contrast, about one-third or higher of the unvaccinated in many other occupational settings reported being vaccine unsure, including those working in pharmacies (62.6%), social service workers (46.6%), US Postal Service workers (41.3%), people working in correctional facilities (37.4%), retailers in food or beverage stores (37.8%) and healthcare workers in ambulatory facilities (36.2%),
Factors associated with the different vaccine dispositions among the unvaccinated
Within adjusted analysis (table 3), vaccine acceptance was lower among those with an associate degree (APR=0.60, 95% CI 0.43 to 0.82), earning 200 000 per annum (APR=0.45, 95% CI 0.26 to 0.77), working in a private company (APR=0.74, 95% CI 0.61 to 0.91) or self-employed (APR=0.69, 95% CI 0.51 to 0.94), whereas Hispanics (APR=2.24, 95% CI 1.83 to 2.74) and blacks (APR=2.30, 95% CI 1.85 to 2.86) were twice as likely to be vaccine accepting than whites. The relationship with vaccine aversion was in the opposite direction for many of these subgroups. For example, lower likelihood of vaccine aversion was seen among Hispanics (APR=0.68, 95% CI 0.61 to 0.77) and blacks (APR=0.65, 95% CI 0.56 to 0.74) than whites. The likelihood of vaccine aversion was further higher among those self-employed (APR=1.11, 95% CI 1.02 to 1.22) or working in a private company (APR=1.09, 95% CI 1.01 to 1.17) than those unemployed; living in a detached, single-family house than in a multiunit apartment (APR=1.15, 95% CI 1.04 to 1.26), insured by VA/Tricare than uninsured (APR=1.22, 95% CI 1.01 to 1.47), with an associate degree (APR=1.20, 95% CI 1.04 to 1.38) or a graduate degree (APR=1.17, 95% CI 1.02 to 1.35) than those with less than high school; with household income of 200 000+ per annum than less than 25 000 (APR=1.15, 95% CI 1.01 to 1.30) and aged 25–44 years (APR=1.19, 95% CI 1.03 to 1.36), 45–64 years (APR=1.26, 95% CI 1.10 to 1.36) and 65+ years (APR=1.40, 95% CI 1.19 to 1.64) than 18–24 years. Women were less likely to endorse definitive pro-vaccine or antivaccine sentiments and more likely to report being vaccine unsure (table 3). Individuals with symptoms of mental illness were less likely to be vaccine averse and more likely to be either vaccine unsure or vaccine accepting.
Adjusted prevalence ratios (APR) for factors associated with various vaccine dispositions among unvaccinated US adults, Household Pulse Survey, 1 December 2021 to 7 February 2022
Reasons for being unvaccinated and decomposition analysis of what accounts for the gap in vaccine aversion among subgroups
Reasons for having not yet received a vaccine differed among those vaccine accepting, unsure and averse (figure 1). The percentage reporting logistical or access-related barriers to getting a vaccine (eg, difficulty getting a vaccine, or perceived cost of the vaccine) while low in the absolute context among the segment of the unvaccinated identifying as vaccine accepting was relatively higher than those vaccine unsure or averse. Those vaccine unsure reported the highest prevalence of barriers related to perceived safety/effectiveness, including wanting to ‘wait and see’ if the vaccines were safe (45.2%) and uncertainty as to whether the vaccines would be effective in protecting them from COVID-19 (29.6%). Those vaccine averse reported the highest prevalence for barriers pertaining to lack of trust in the government or in the vaccines (50.1% and 57.5%, respectively), the perception that COVID-19 was not that big of a threat (32.2%) or perception that they did not need a vaccine (42.3%). Other barriers are shown in figure 2.

Comparison of reasons for having not yet received a COVID-19 vaccine among unvaccinated US adults who were vaccine averse, vaccine unsure and vaccine accepting. Household Pulse Survey, 1 December 2021 to 7 February 2022.
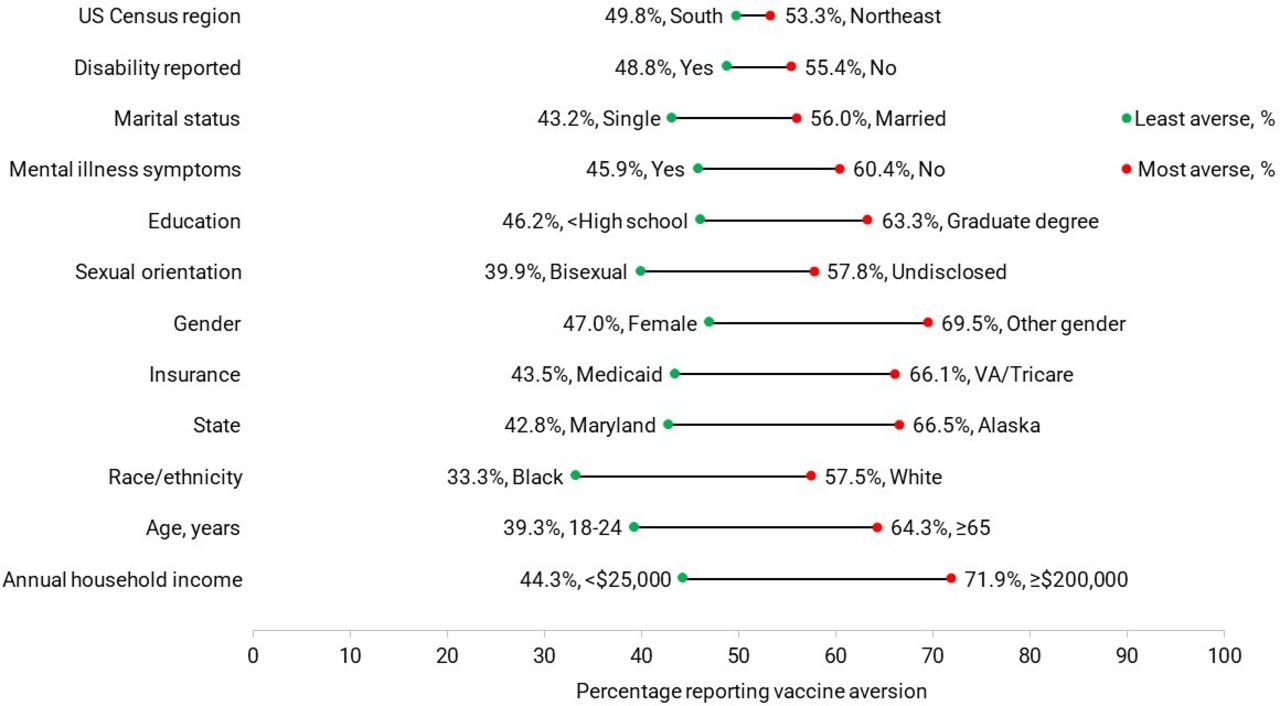
Decomposition analysis revealed wide variability in what accounted for the gap in vaccine aversion among subgroups, with the dominant explanatory variables being differences in perceived safety/effectiveness and susceptibility/seriousness (table 4). The gap in vaccine aversion between extremes of various sociodemographic characteristics is visualised in figure 3. Of the gap in vaccine aversion at the extremes of age, for example, the largest amount of this gap, 43.6%, was explained by differences in ‘wait and see’ sentiments (indicating that the gap in vaccine aversion would be reduced by 43.6% if the more vaccine-averse older adults were more willing to take a softer ‘wait and see’ stance towards COVID-19 vaccines as were younger adults). Differences in the perception by respondents that they did not need the COVID-19 vaccine explained the 22.3% of the vaccine aversion gap across the extremes of age (indicating that the gap in vaccine aversion would have even been wider by 22.3% if older adults aged 65+ years endorsed this sentiment to the same high level as 18–24 year-olds). Differences in perceived susceptibility/seriousness of COVID-19 vaccine were the most important explanatory variable for the gap in vaccine aversion along the lines of education, sexual orientation, gender, state, income and race/ethnicity. For example, when comparing white-black differences in vaccine aversion, 31.3% of this gap was explained by more whites endorsing low perceived susceptibility and low perceived seriousness of COVID-19; 18.7% of the gap was attributable to greater distrust of government and of the vaccine among whites; and 12.6% of the gap was attributable to differences in perceived safety/efficacy. Furthermore, a small but statistically significant portion of this gap (2.1%) was attributable to more whites than blacks reporting that their doctor failed to offer the vaccine to them. Other results are shown in table 4.
Gaps in vaccine aversion between the least and the most averse subgroups of unvaccinated US adults, by selected indicators. Household Pulse Survey, 1 December 2021 to 7 February 2022. VA, Veterans Affairs.
Blinder-Oaxaca decomposition analysis of what psychographic factors explain the gap in vaccine aversion between the most and least averse subgroups based on selected indicators for the unvaccinated US adult population, Household Pulse Survey, 1 December 2021 to 7 February 2022
Discussion
We found systematic differences in the sociodemographic and psychographic characteristics of individuals who were vaccine averse, unsure or accepting. Vaccine-accepting individuals were more likely to be racial minorities (black, Hispanic or other race), have unknown health insurance, have unknown income and report symptoms of mental illness. Conversely, vaccine-averse individuals were mostly white, older, wealthy, highly educated and self-employed or private sector-employed adults. Vaccine-accepting adults reported the highest percentage for logistical challenges as a barrier to vaccination; those vaccine unsure reported the highest percentage for uncertainty around safety/effectiveness, whereas those vaccine averse reported the highest percentage for ideological reasons for non-vaccination (eg, perceived low susceptibility and low perceived seriousness of COVID-19). The psychographic and sociodemographic characteristics of these three different segments (averse, unsure or accepting), including their identified barriers/motivators, can inform tailored interventions to overcome impeding constraints to vaccination. For example, to increase the vaccine coverage among the vaccine accepting in current or future vaccination campaigns, it would be helpful to consider expanding access to include non-traditional settings, including barber shops, religious centres, fitness centres and home vaccinations. For the vaccine unsure, lessons can be drawn from the normalisation of certain other preventive public health interventions, such as the use of social media by the Centers for Disease Control and Prevention to rightly inform people about public health issues.18 The use of famous individuals who were previously hesitant but are now vaccinated as COVID-19 vaccine ambassadors may also help overcome certain objections to receiving vaccines.19 While it is possible that there are some vaccine-averse individuals who might still be swayed at this point, that population is likely quite small due to ideological beliefs about vaccines and distrust of the government which, while it is not impossible, are unlikely to be remediated by the medical/public health community. Nevertheless, there is value in characterising the unvaccinated population by adverse, unsure and accepting, as we have done in this manuscript, to form a more nuanced picture of barriers to vaccination among these groups. This characterisation is valuable, particularly when viewed through the lens of future vaccination efforts for other infectious diseases that may emerge (or re-emerge).
Among the unvaccinated population, we found dramatic differences in their vaccine dispositions based on their occupational settings. Application of the health belief model in this context would suggest that perceived risk and perceived susceptibility would differ conceivably based on actual exposure risk to COVID-19 in one’s day-to-day life.20 21 However, with the pandemic being so drawn out in duration, there is the possibility of habituation, that is, lowered perceived risk in the context of continuous or exposure. Habituation may explain why past COVID-19 diagnosis was not significantly associated with vaccine disposition among the unvaccinated.22 Habituation may further explain why funeral home workers had the least percentage of those who were vaccine unsure (ie, ambivalent to receiving a vaccine, 7.2%)—most of the workers in this setting were anchored to the more definitive dispositions of vaccine aversion or vaccine acceptance, with the former being the majority at 67.0%. Currently, the cases are more than 93 million and an estimation of 98.2% recovery rate.21 23 24 Therefore, perceived seriousness of COVID-19 may be lowered even if perceived susceptibility is high. With COVID-19 rising to become the third leading cause of death in the USA, surpassed only by heart disease and cancer,25 deathcare workers who have managed a lot of COVID-19-related deaths may become firmly committed to a definitive stance on vaccines based on anecdotal evidence around them. In contrast, pharmacy workers had the highest percentage of those vaccine unsure among the unvaccinated, at 62.6%, which is a paradox given that pharmacies have been a key location for vaccinations in the USA.26 The probability of vaccine aversion among the unvaccinated also increased with increasing age; it is not clear whether this age trend is due to older adults being more set in their ways, or that they have higher likelihood of having conditions that could be flagged as precautions or contraindications for COVID-19 vaccine. Examples of these precautions include people who experience symptoms immediately (in less than 4 hours) and generalised symptoms of a likely allergic reaction and individuals with a generalised allergic reaction to any constituent of the COVID-19 vaccine to be given, while examples of contraindications include anaphylaxis to an initial dose of an mRNA COVID-19 vaccine and anaphylaxis to any constituent of the vaccine, such as polyethylene glycol.27 From a surveillance perspective, it will be helpful to include questions on health conditions associated with vaccine disposition so that a differentiation can be made between those vaccine averse and those vaccine ineligible. This differentiation is important because it has implications for targeted public health interventions.
All 50 US states and DC have exceeded the 70% vaccine coverage targeted set up by WHO28; the range of vaccine coverage in our study was from 71.0% (Wyoming) to 94.2% (DC). The USA currently ranks sixth out of 10 top-income and high-income countries in terms of vaccine coverage,29 30 with 79% of the US adult population having received at least one dose of the vaccine.31 Disparities, however, existed, as the percentage of unvaccinated was highest among transgender, those with low income, uninsured, with two or more small children aged less than 5 years in their household and young adults. It would be important to monitor the equity impact of population interventions to increase vaccine coverage to ensure existing disparities are not being widened. It would also benefit public health to understand and address the unique challenges and concerns of these populations to increase vaccine uptake.
Limitations
The findings in this report are subject to several limitations. First, self-reported measures may be subject to misreporting, including COVID-19 diagnosis and vaccination status. Second, small sample sizes for some population subgroups resulted in some imprecise estimates. Third, the results of this study may not be generalisable to individuals outside the sampling frame, including persons in the military, in prisons or other institutionalised settings. Despite adjustment for differential non-response bias, the web-based survey may have resulted in some selection bias to the exclusion of individuals of low socioeconomic status. Fourth, there was not much information on other health issues that might be related to the willingness to take a COVID-19 vaccine. This consideration is important as some proportion of the population may not be eligible for certain vaccination on account of contraindicating conditions such as history of a severe allergic reaction (eg, anaphylaxis) after a previous dose or to a component of the COVID-19 vaccine. Still, others may have conditions that, while not outrightly contraindicating a COVID-19 vaccine, warrant precaution, such as those with history of anaphylaxis after any vaccine other than COVID-19 vaccine or after any injectable therapy (ie, intramuscular, intravenous or subcutaneous vaccines or therapies).32 Finally, we urge cautious interpretation of our measures of association as they do not imply causation.
Conclusion
Our study provides new insights into three vaccine dispositions among the unvaccinated segment of the population: those who are vaccine unsure, vaccine averse and vaccine accepting. Our analyses demonstrated that these segments have distinct sociodemographic and psychographic characteristics, which could lend to targeted interventions. Vaccine-accepting individuals were more likely to be racial minorities (black, Hispanic or other race), have unknown health insurance, have unknown income and report symptoms of mental illness. Conversely, vaccine-averse individuals were mostly white, older, wealthy, highly educated and self-employed or private sector-employed adults. The ‘unsure’ and ‘accepting’ in particular are potential targets for interventions to increase vaccine coverage, with different approaches for each.
Data availability statement
Data are available in a public, open access repository. All data analysed are publicly available at https://www.census.gov/programs-surveys/household-pulse-survey/datasets.html.
Ethics statements
Patient consent for publication
Footnotes
Contributors IA conceptualised the manuscript and performed the analysis. All authors contributed to interpreting the data, extensively revising and drafting the manuscript, and approving the manuscript to be submitted. IA accepts full responsibility for the work, had access to the data, and submitted the manuscript for publication.
Funding The authors have not declared a specific grant for this research from any funding agency in the public, commercial or not-for-profit sectors.
Map disclaimer The depiction of boundaries on this map does not imply the expression of any opinion whatsoever on the part of BMJ (or any member of its group) concerning the legal status of any country, territory, jurisdiction or area or of its authorities. This map is provided without any warranty of any kind, either express or implied.
Competing interests None declared.
Provenance and peer review Not commissioned; externally peer reviewed.